- The EUR/USD pair maintains a bearish bias despite the current rebound.
- A new lower low activated a larger drop.
- Making a valid breakout above the upper median line (UML) could confirm a larger rebound.
The EUR/USD price rallied in the short term after failing to take out the 1.0396 downside obstacle. It climbed as high as 1.0488 in yesterday’s trading session. The USD lost significant ground versus its rivals as the US data came in worse than expected yesterday.
–Are you interested in learning more about Canadian forex brokers? Check our detailed guide-
Still, the rebound could be only a temporary one. The EUR/USD pair could only test the immediate resistance levels before dropping again. Now, it is trading at the 1.0462 level, where it seems undecided.
Today, the fundamentals could move the market, so you should be careful. The Eurozone CPI Flash Estimate rose by 8.6% versus 8.5% estimates, while Core CPI Flash Estimate registered a 3.7% growth less compared to the 3.7% forecasted. In addition, the Final Manufacturing PMI jumped from 52.0 to 52.1 points above 52.0, expected to signal further expansion, while the German Final Manufacturing PMI came in at 52.0 points, matching expectations.
Later, the US ISM Manufacturing PMI is seen as a high-impact indicator and is expected to drop from 56.1 to 54.6 points. This could be bad for the USD. Furthermore, the Final Manufacturing PMI could remain steady at 52.4 points, Construction Spending could report a 0.3% growth, and ISM Manufacturing Prices are expected to drop to 80.0 from 82.2 points. In contrast, Ward’s Total Prices could come in at 13.3M above 12.7M.
EUR/USD price technical analysis: Ranging
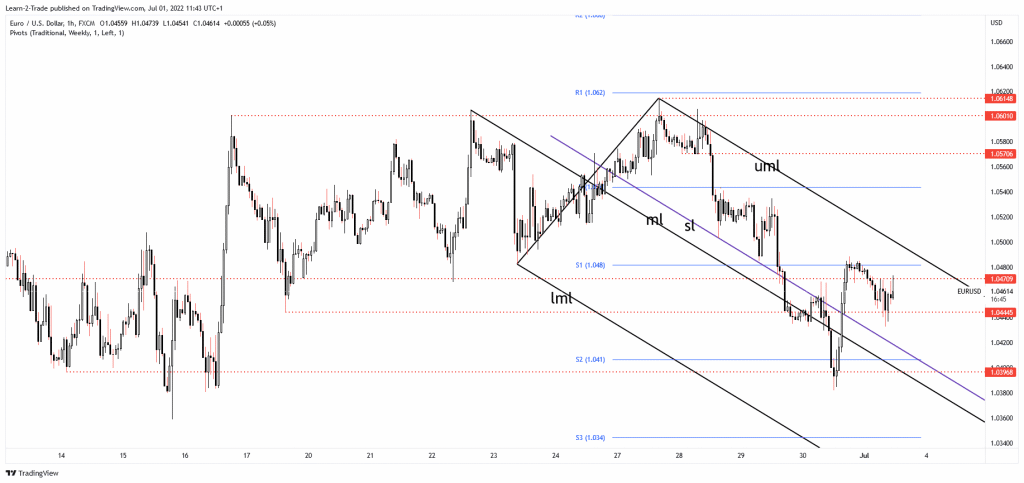
As you can see on the 1-hour chart, the EUR/USD found support right below the 1.0396 level. We have a strong demand zone around the former lows. That’s why the currency pair rallied. Now, it has jumped above 1.0470 but failed to stay above this upside obstacle. The weekly S1 (1.0482) stopped the upside momentum, and it has dropped again.
–Are you interested in learning more about high leveraged brokers? Check our detailed guide-
In the short term, it’s trapped between 1.0444 and 1.0470 levels. The US data could bring high volatility and sharp movements. Technically, the bias remains bearish. The current rebound could bring new selling opportunities. The descending pitchfork’s upper median line (UML) represents a dynamic resistance.
As long as it stays under this line, the EUR/USD could come back down. Only a valid breakout above it may signal a larger growth. In the short term, it could continue to move sideways. The price is trapped between 1.0396 and 1.0601 levels. Only a new lower low, dropping and closing below 1.0396, could activate a larger drop.
Looking to trade forex now? Invest at eToro!
68% of retail investor accounts lose money when trading CFDs with this provider. You should consider whether you can afford to take the high risk of losing your money
