- The EUR/USD pair developed a bearish continuation pattern.
- A new lower low could activate more declines.
- Only a new higher high may signal a larger rebound.
The EUR/USD price is trading in the red at 1.0189 at the time of writing. The bias remains bearish, so a further drop is in the cards.
-Are you interested to find high leverage brokers? Check our detailed guide-
Still, after its massive drop, the price tries to rebound. Technically, a temporary bounce back could bring new selling opportunities. The price may test the near-term resistance levels before dropping deeper. The price action developed a downside continuation pattern, so we’ll have to wait for confirmation before taking action.
The pair rebounded as the Dollar Index retreated even if the US data came in better than expected yesterday. The ISM Services PMI, JOLTS Job Openings, and the Final Services PMI reported better than expected figures.
Still, despite positive economic data, the DXY seems overbought after its amazing rally. That’s why a minor retreat is natural. Fundamentally, the USD remains bullish despite a temporary retreat. The FED is expected to hike the Federal Funds Rate by 0.50% or 0.75% in the July meeting.
Today, German Industrial Production rose by 0.2% less compared to the 0.3% growth expected. Later, the US Unemployment Claims indicator is expected to be 230K below 231K in the previous reporting period, while Trade Balance could come in at 2.5B.
EUR/USD price technical analysis: Flag formation
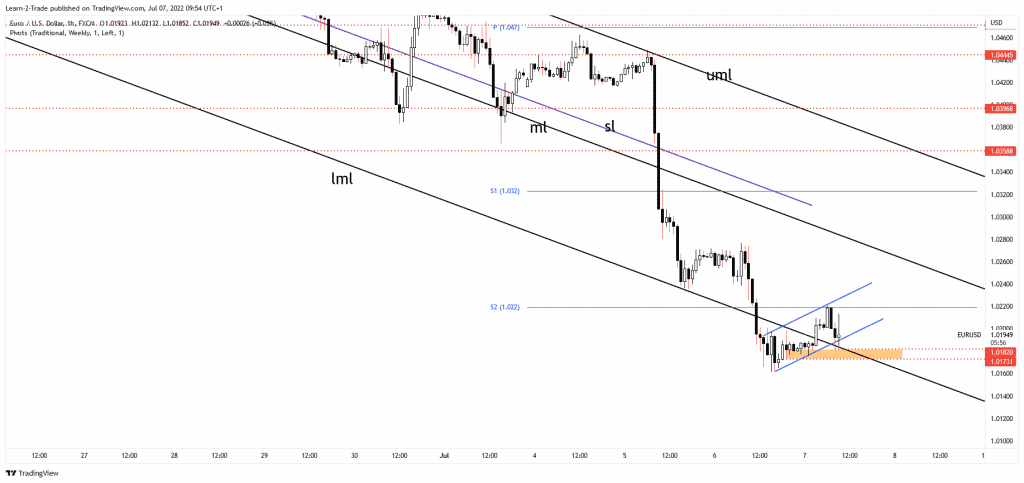
The EUR/USD pair found temporary support at the 1.0173 – 1.0182 area. As long as it stays above this zone, it could try to come back to test and retest the weekly S2 (1.0220), which stands as a resistance level.
-Looking for high probability free forex signals? Let’s check out-
As you can see on the 1-hour chart, the price action developed an up-channel pattern that could announce a downside continuation. A new lower low, a valid breakdown below 1.0173, could activate more declines. Only a new higher high, jumping, closing, and stabilizing above 1.0220 could announce a larger rebound towards the median line (ml) of the descending pitchfork.
After its massive drop, a temporary rise is natural. The median line (ml) represents strong dynamic resistance. The bias remains bearish if the EUR/USD pair is traded below it.
Looking to trade forex now? Invest at eToro!
68% of retail investor accounts lose money when trading CFDs with this provider. You should consider whether you can afford to take the high risk of losing your money
