- GBP/USD remains mildly bullish, supported by the 20-SMA on the 4-hour chart.
- Better risk tone is also lending support to the Cable.
- Fed’s expected dovish stance can further help the bulls
The GBP/USD price remains mildly bullish under the 1.3800 handle. On Monday, we saw the pair rallied beyond the 1.3800 handle. But it could not sustain the buying momentum and pared off gains and came below the key level of 1.3800.
–Are you interested to learn more about automated trading? Check our detailed guide-
The risk tone of the market is much improved today. The soared risk sentiment is weighing on the Greenback and eventually helping the riskier assets like Pound Sterling.
However, the Delta fear is not over. It’s hovering over the heads and will keep pressure on the Pound for now. The number of cases is increasing in the UK, and the government has been criticized for lifting the restrictions. Any further negative development can ruin the risk sentiment.
Investors are now keenly waiting for the Fed’s interest rate and statement to find further directional bias. However, a higher probability lies in the Fed acting dovish because they need a more accommodative policy to further service their debts.
GBP/USD price technical analysis: What bulls can do?
Yesterday, the GBP/USD price continued its correctional rise. The price broke through the resistance level of 1.3800. Today, the upward movement has not received any further bids. Most likely, we can see the formation of a pullback movement in the direction of the 4-hour hour trendline.
The bullish scenario will become relevant again after yesterday’s highs are broken.
The MACD histogram is still in the positive zone and above its signal line, continues to grow rapidly and thus gives a signal to buy the British Pound (GBP).
The Stochastic Oscillator is in the overbought zone and gives a similar signal, as the% K line rises above the% D line.
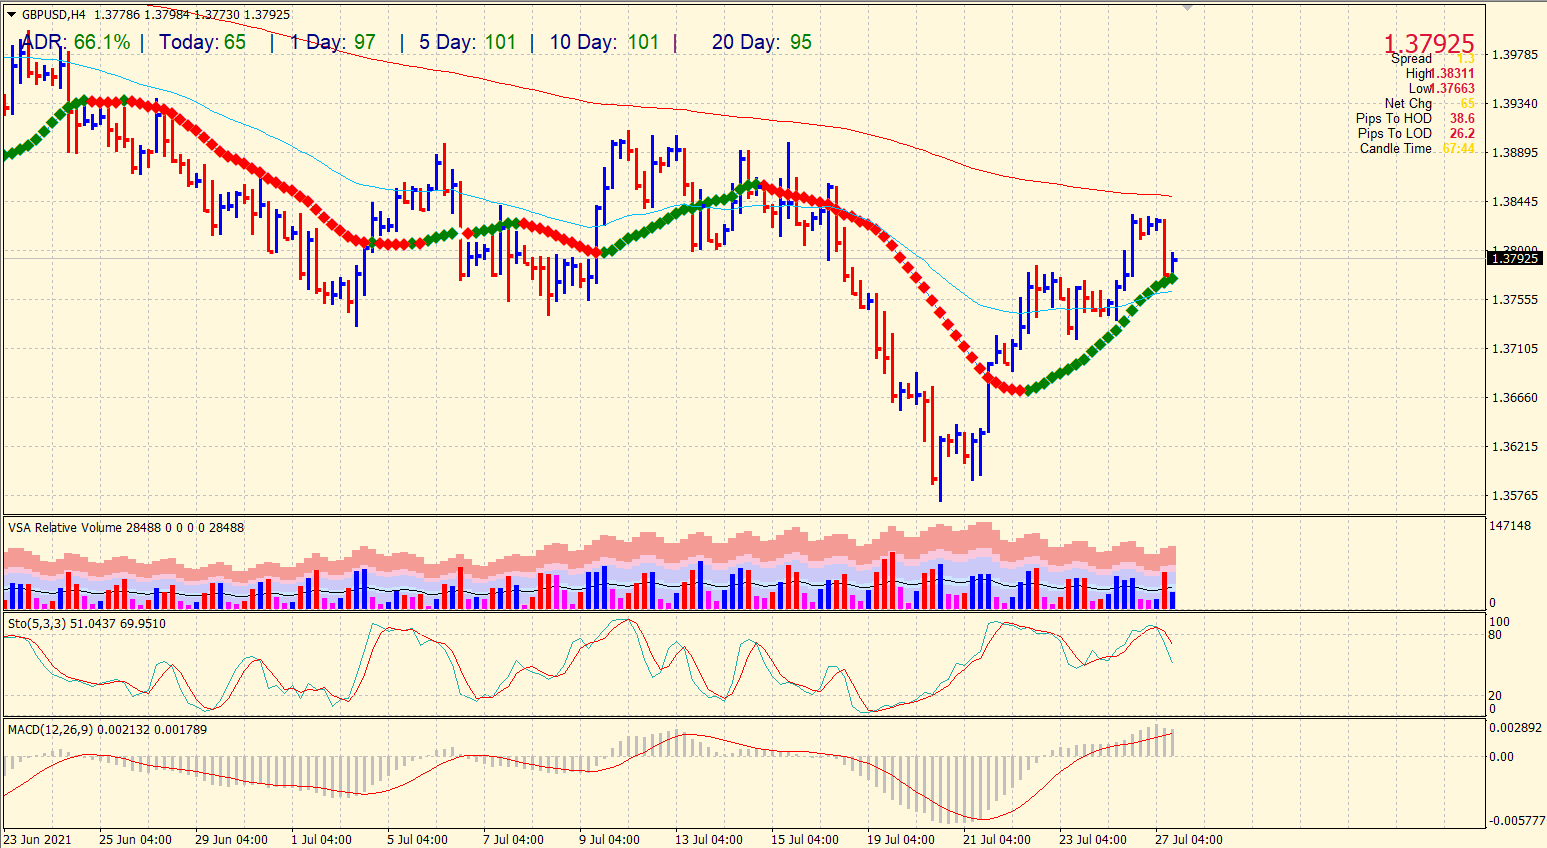
Therefore, we expect that the bulls may resume, and the potential targets of the bulls are located at 1.38585, 1.38925 and 1.3939.
The bullish scenario will be nullified in case of a breakdown of the support level 1.3817, which may open the way to 1.37735, 1.37305 and 1.3698.
–Are you interested to learn more about forex signals? Check our detailed guide-
Resistance levels: 1.38325, 1.3844, 1.38585, 1.38925, 1.39005, 1.39045, 1.3917, 1.3939
Current price: 1.3826
Support levels: 1.3817, 1.3811, 1.37995, 1.37805, 1.37735, 1.37545, 1.37465, 1.37305
Looking to trade forex now? Invest at eToro!
67% of retail investor accounts lose money when trading CFDs with this provider. You should consider whether you can afford to take the high risk of losing your money.
