GBP/USD reversed directions last week, gaining 200 points. The pair closed at the 1.31 line. This week’s highlights are CPI and Retail Sales. Here is an outlook for the highlights of this week and an updated technical analysis for GBP/USD.
In the UK, Brexit jitters increased as all three PMIs reported softer growth in May and missed estimates. The latest political scandal involving Donald Trump Jr. has hurt the dollar, and Yellen’s concern about low inflation also weighed on the greenback.
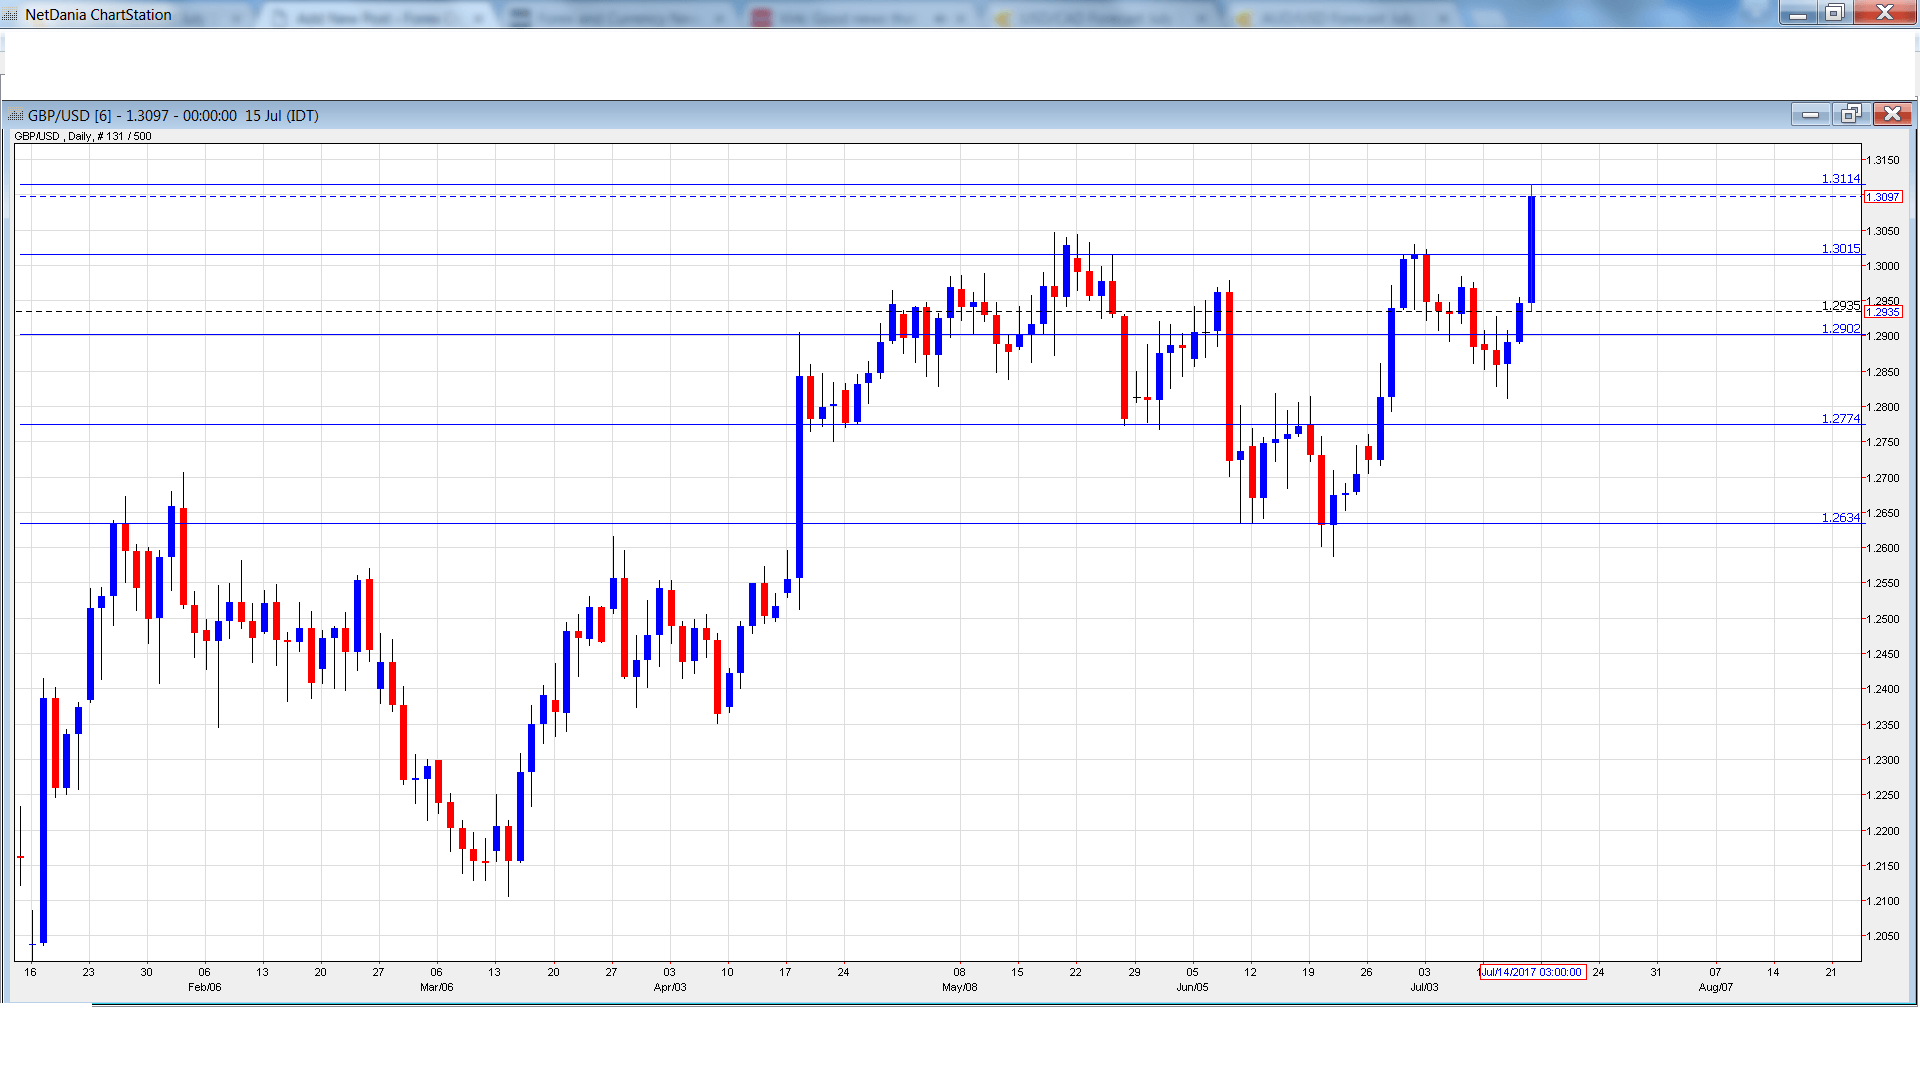
[do action=”autoupdate” tag=”GBPUSDUpdate”/]GBP/USD graph with support and resistance lines on it. Click to enlarge:
- Rightmove HPI: Sunday, 23:01. This indicator is a gauge of activity in the housing sector. The June reading of -0.4% was the first decline in 2017. Will we see a gain in the July report?
- CPI: Tuesday, 8:30. CPI is one of the most important indicators and should be treated as a market-mover. Inflation continues to rise and climbed to 2.9% in May, beating the estimate of 2.7%. Another gain of 2.9% is expected in June.
- PPI Input: Tuesday, 8:30. This indicator measures inflation in goods and services purchased by manufacturers. In May, the index declined 1.3%, worse than the forecast of -0.5%. Another decline is expected in June, with an estimate of -0.8%.
- RPI: Tuesday, 8:30. RPI is similar to CPI but excludes housing costs. The index continues to climb, and hit 3.9% in May, above the estimate of 3.7%. The forecast for June is 3.6%.
- BoE Governor Mark Carney Speaks: Tuesday, 13:30. Carney will speak at an event in Hampshire. The markets will be looking for clues regarding future rate hikes.
- Retail Sales: Thursday, 8:30. This is the primary gauge of consumer spending. In May, the indicator declined 1.2%, missing the estimate of -0.9%. The markets are expecting a rebound in June, with an estimate of 0.3%.
- Public Sector Net Borrowing: Friday, 8:30. The UK deficit narrowed to GBP 6.0 billion in May, smaller than the estimate of GBP 7.3 billion. The deficit is expected to continue to shrink in June, with an estimate of GBP 4.3 billion.
*All times are GMT
GBP/USD Technical Analysis
GBP/USD opened the week at 1.2888 and dropped to a low of 1.2811. It was all uphill from there, as the pair jumped to 1.3114, testing resistance at 1.3112 (discussed last week). GBP/USD closed the week at 1.3097.
Technical lines from top to bottom
We start with resistance at 1.3480.
1.3347 has held in resistance since September 2016.
1.3238 is next.
1.3112 was tested in resistance as the pair posted sharp gains late in the week.
1.3020 is an immediate support line. It is protecting the symbolic 1.30 line.
1.2902 is the next support line.
1.2775 has been a cushion in July.
1.2634 is the final support line for now.
I am neutral on GBP/USD.
The British economy is showing some signs of fatigue and the Brexit cloud is making investors nervous. The Fed is on record that it will raise interest rates a third time in 2017, but the markets have their doubts, as inflation remains weak and second quarter numbers in the US have not impressed.
Our latest podcast is titled Yellen is not loving it, markets do
Follow us on Sticher or iTunes
Safe trading!
Further reading:
- For a broad view of all the week’s major events worldwide, read the USD outlook.
- For EUR/USD, check out the Euro to Dollar forecast.
- For the Japanese yen, read the USD/JPY forecast.
- For the kiwi, see the NZD/USD forecast.
- For the Australian dollar (Aussie), check out the AUD to USD forecast.
- For the Canadian dollar (loonie), check out the USD to CAD forecast.
