- Oil prices are falling as demand concerns grow due to China’s COVID restrictions.
- Chinese are protesting against President Xi Jinping’s zero-COVID policy.
- The dollar rose after hawkish remarks from Fed’s James Bullard.
Today’s USD/CAD price analysis is bullish as the Canadian dollar weakens on lower oil prices. Tuesday’s early trade saw a decline in oil prices due to worries about China, the world’s largest crude importer, slowing down its fuel demand due to COVID-19 restrictions.
–Are you interested in learning more about spread betting brokers? Check our detailed guide-
“Bearish moods toward oil prices are spreading in Asia due to concerns about a decline in China’s demand while the rare protests over the weekend also raised fears over the impact on the Chinese economy,” said Toshitaka Tazawa, an analyst at Fujitomi Securities Co Ltd.
The uncommon street demonstrations that broke out over the weekend in many Chinese cities were a protest against President Xi Jinping’s zero-COVID policy and the strongest show of public opposition in his political career.
USD/CAD also climbed due to dollar strength. The dollar recovered in early US trading and added to gains after St. Louis Fed President James Bullard stated that the US central bank needs to raise interest rates a bit more and then maintain them there throughout next year and into 2024. It will help control inflation and bring it back toward the Fed’s 2% goal.
USD/CAD key events today
Canada will be releasing GDP data that will shine a light on the economy. Investors will also pay attention to the CB consumer confidence from the US. The Conference Board’s (CB) Consumer Confidence gauges how confident consumers are about the economy as a whole. It is a leading indicator because it can forecast consumer spending, which is crucial to overall economic activity.
USD/CAD technical price analysis: Short pullback from strong resistance
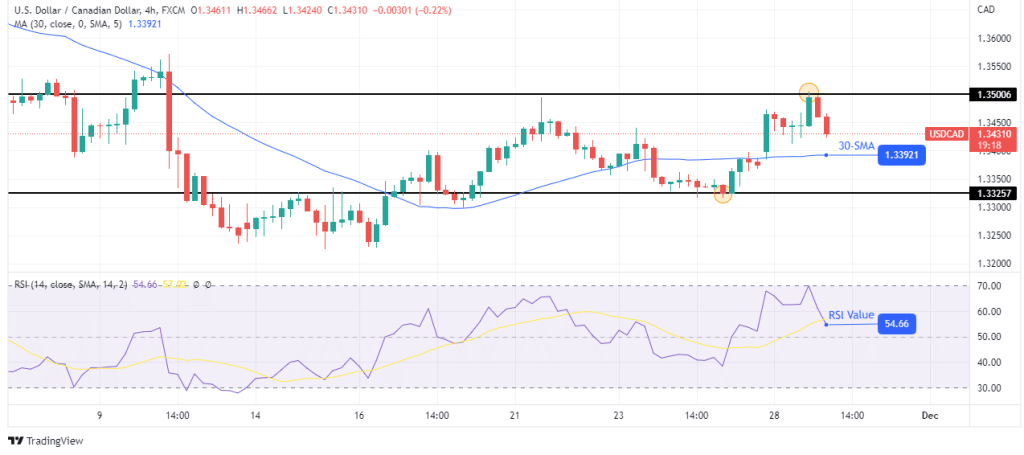
The 4-hour chart shows the price trading above the 30-SMA and the RSI above 50. This is a sign that the current move is bullish. The price is pulling back to retest the 30-SMA as support after failing to go above the 1.3500 resistance.
–Are you interested in learning more about AI trading brokers? Check our detailed guide-
If bulls are still stronger, the pullback will pause at the 30-SMA, and the price will bounce higher. Such a move would mean retesting and possibly breaking above the 1.3500 resistance. However, bears might get strong enough to break below the 30-SMA. If that happens, the price will fall to 1.3325 support.
Looking to trade forex now? Invest at eToro!
67% of retail investor accounts lose money when trading CFDs with this provider. You should consider whether you can afford to take the high risk of losing your money.
