- The USD/CHF pair moves in an extended range, so we’ll have to wait for a valid breakout.
- Technically, a valid breakout from the current triangle could bring a clear direction.
- The traders could wait for the US Non-Farm Payrolls publication before taking action.
The USD/CHF price outlook moves sideways in the short term, but we’ll likely have a clear direction soon. The price action has printed a minor symmetrical triangle on the 4-hour chart. Escaping from this formation brings great trading opportunities.
–Are you interested to learn more about day trading brokers? Check our detailed guide-
Still, the traders could wait for the US Non-Farm Payrolls release before driving the price in one direction. As you already know, the NFP is expected around 750K in August versus 943K in July. Also, the Unemployment Rate could drop from 5.4% to 5.2%, while the Average Hourly Earnings will rise by 0.3% in August compared to 0.4% in the previous reporting period.
Surprisingly or not, the USD/CHF pair rises when writing even if the DXY stays lower. This is because the dollar started to gain versus its rivals after the Unemployment Claims dropped to 340K versus 342K expected and after the Factory Orders indicator had managed to rise by 0.4% marching expectations.
Fundamentally, the Swiss Franc has lost ground after the Switzerland Retail Sales dropped by 2.6%, even if the specialists have expected a 0.2% growth. The GDP reported a 1.8% growth compared to 1.9% expected. Switzerland CPI increased by 0.2%, beating the 0.1% estimate.
USD/CHF price technical outlook: Triangle pattern to hold
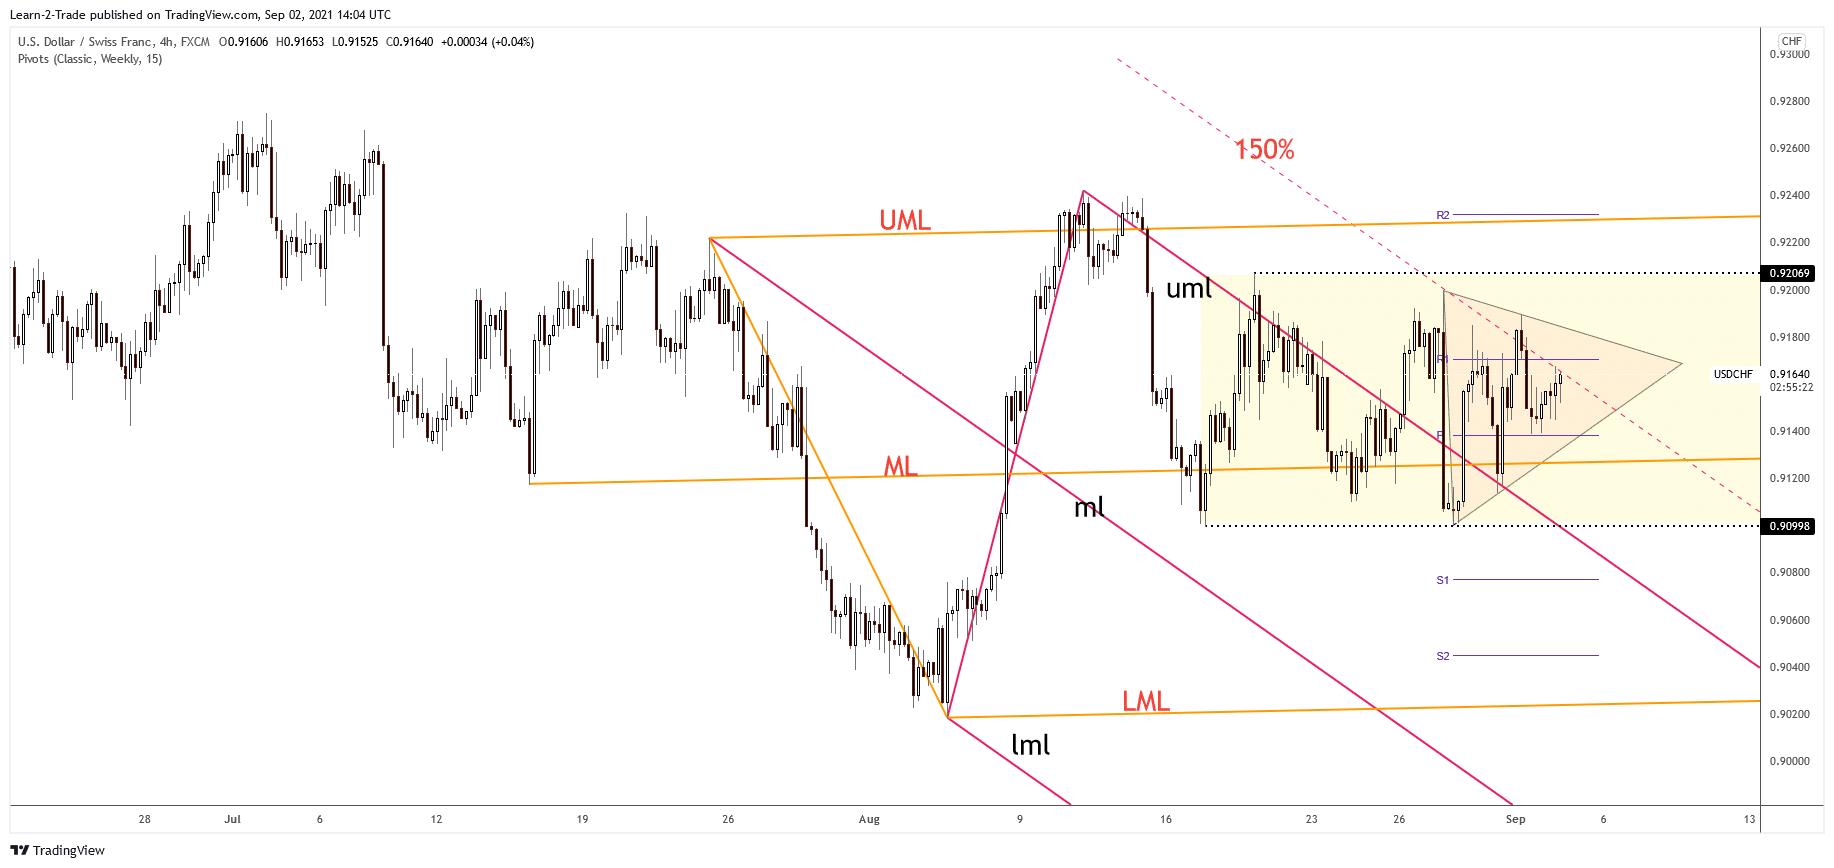
The USD/CHF pair is trapped between 0.9099 and 0.9206 levels. It’s traded somewhere at the half of this range. As you can see on the H4 chart, the price has developed a symmetrical triangle. Making a valid breakout from this pattern could bring new trading opportunities. It moves between the weekly pivot point of (0.9138) and the 0.9170 R1 levels in the short term.
–Are you interested to learn more about forex signals? Check our detailed guide-
Technically, the 150% Fibonacci line is seen as a dynamic resistance. A valid breakout above it could signal an upside breakout from the current triangle as well. The USD/CHF pair failed to approach and reach the 0.9099 or the 0.9206 levels in the last attempts. We’ll have to wait for the price to get out from the current triangle to know the direction. Making a valid breakout above 0.9189 immediate high indicates an upside continuation.
Looking to trade forex now? Invest at eToro!
67% of retail investor accounts lose money when trading CFDs with this provider. You should consider whether you can afford to take the high risk of losing your money.
