- The USD/CHF pair could develop an important growth if it makes a valid breakout above the upper median line (UML).
- Its failure to reach the median line (ml) signaled that the sellers are exhausted.
- The US data has come in better than expected earlier, so the greenback could take full control.
The USD/CHF price rallied in the last three hours and is almost to hit a critical dynamic resistance. DXY’s rebound forced the pair to rise.
–Are you interested to learn more about day trading brokers? Check our detailed guide-
We have a strong positive correlation between the Dollar Index and the USD/CHF pair. The currency pair moves somehow sideways in the short term. The downside seems limited, so an upwards momentum is favored right now.
The Credit Suisse Economic Expectations was reported at -7.8 versus 42.8.
The US Dollar could jump higher in the short term versus its rivals after the US Core Durable Goods Orders indicator gained by 0.7% in July, beating the 0.5% growth expected and the 0.5% growth registered in June. Furthermore, the Durable Goods Orders dropped only by 0.1%, the specialists have expected a 0.3% drop after the 0.9% growth reported in June.
USD/CHF price technical analysis: Dynamic resistance breakout
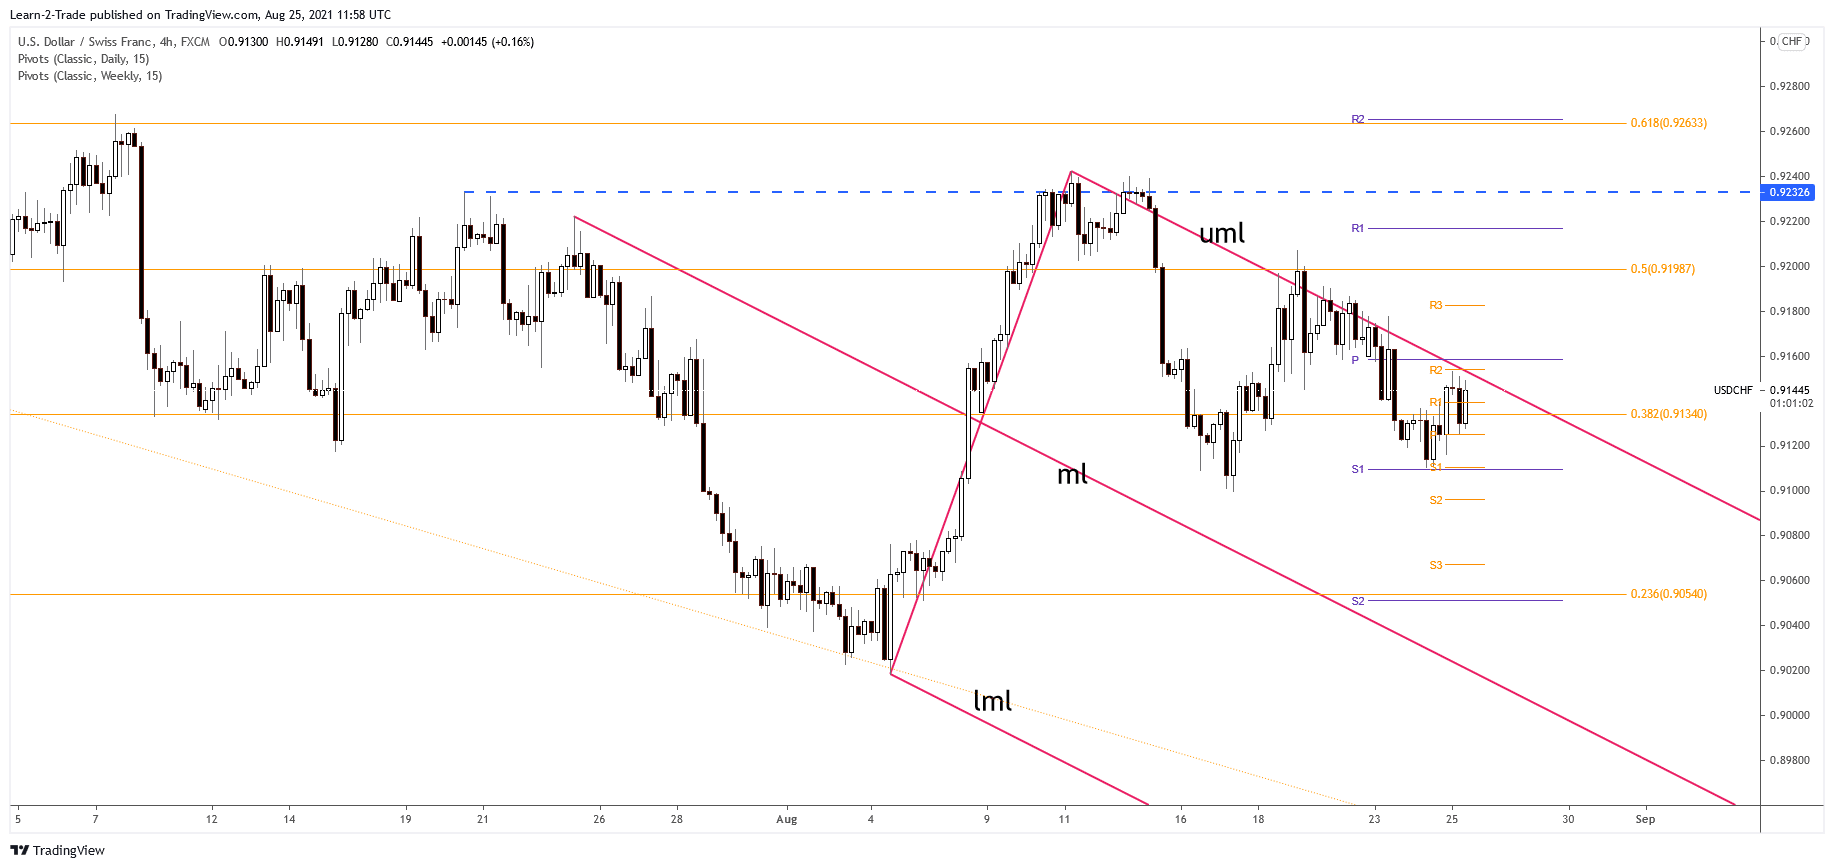
The USD/CHF pair stays near the descending pitchfork’s upper median line (UML). This line is seen as a major dynamic resistance. Making a valid breakout above it could signal a potential strong growth.
Technically, the price has failed to approach and reach the median line (ml) of the descending pitchfork, signaling oversold and exhausted sellers. Also, it has failed to come back towards 0.9099 former low, announcing that the USD/CHF pair could try to come back higher. The weekly pivot point (0.9158) is seen as a resistance level as well. We’ll have to wait for a valid breakout through it as well before deciding to go long.
–Are you interested to learn more about forex bonuses? Check our detailed guide-
From the technical point of view, its failure to approach and reach the median line (ml) could signal a potential growth towards the 0.9232 static resistance. Thus, the current sideways movement could be considered to be a triangle, a continuation pattern. Personally, I believe that only a new lower low, a potential drop below 0.9099, could invalidate the upside scenario.
Looking to trade forex now? Invest at eToro!
67% of retail investor accounts lose money when trading CFDs with this provider. You should consider whether you can afford to take the high risk of losing your money.
