- The USD/JPY pair continues to move sideways, so only a valid breakout from this pattern could bring us new trading opportunities.
- The price action has developed a symmetrical triangle. This formation could bring a clear direction.
- The pair increases as the Dollar Index has managed to rebound, but the pressure remains high.
The USD/JPY price rises when writing as the Dollar Index has managed to break above 92.30 (yesterday’s high). Technically, the price continues to move sideways in the short term. It has developed a potential symmetrical triangle. Maybe we should wait for a valid breakout from this pattern before taking action again.
–Are you interested to learn more about low spread forex brokers? Check our detailed guide-
It seems undecided in the short term. We don’t have a good trading opportunity at the moment. It remains to see how the pair will react as the Nikkei 225 Index has turned to the downside after registering an amazing rally. JP225’s decline signals that the Japanese Yen could gain versus its rivals.
Today, the Japanese economic data has shown mixed numbers. The Leading Indicators was reported at 104.1% above 103.5% expected compared to 104.6% in the previous reporting period. Furthermore, the Average Cash Earnings increased by 1.0% exceeding the 0.2% estimate and the 0.1% growth registered in the last reporting period, while the Household Spending increased by 0.7% less compared to the 2.6% estimates.
Tomorrow, Japan will release the Economic Watchers Sentiment, Final GDP, Final GDP Price Index, and the Current Account. These economic figures could bring more life to the USD/JPY pair.
USD/JPY price technical analysis: Symmetrical triangle to play
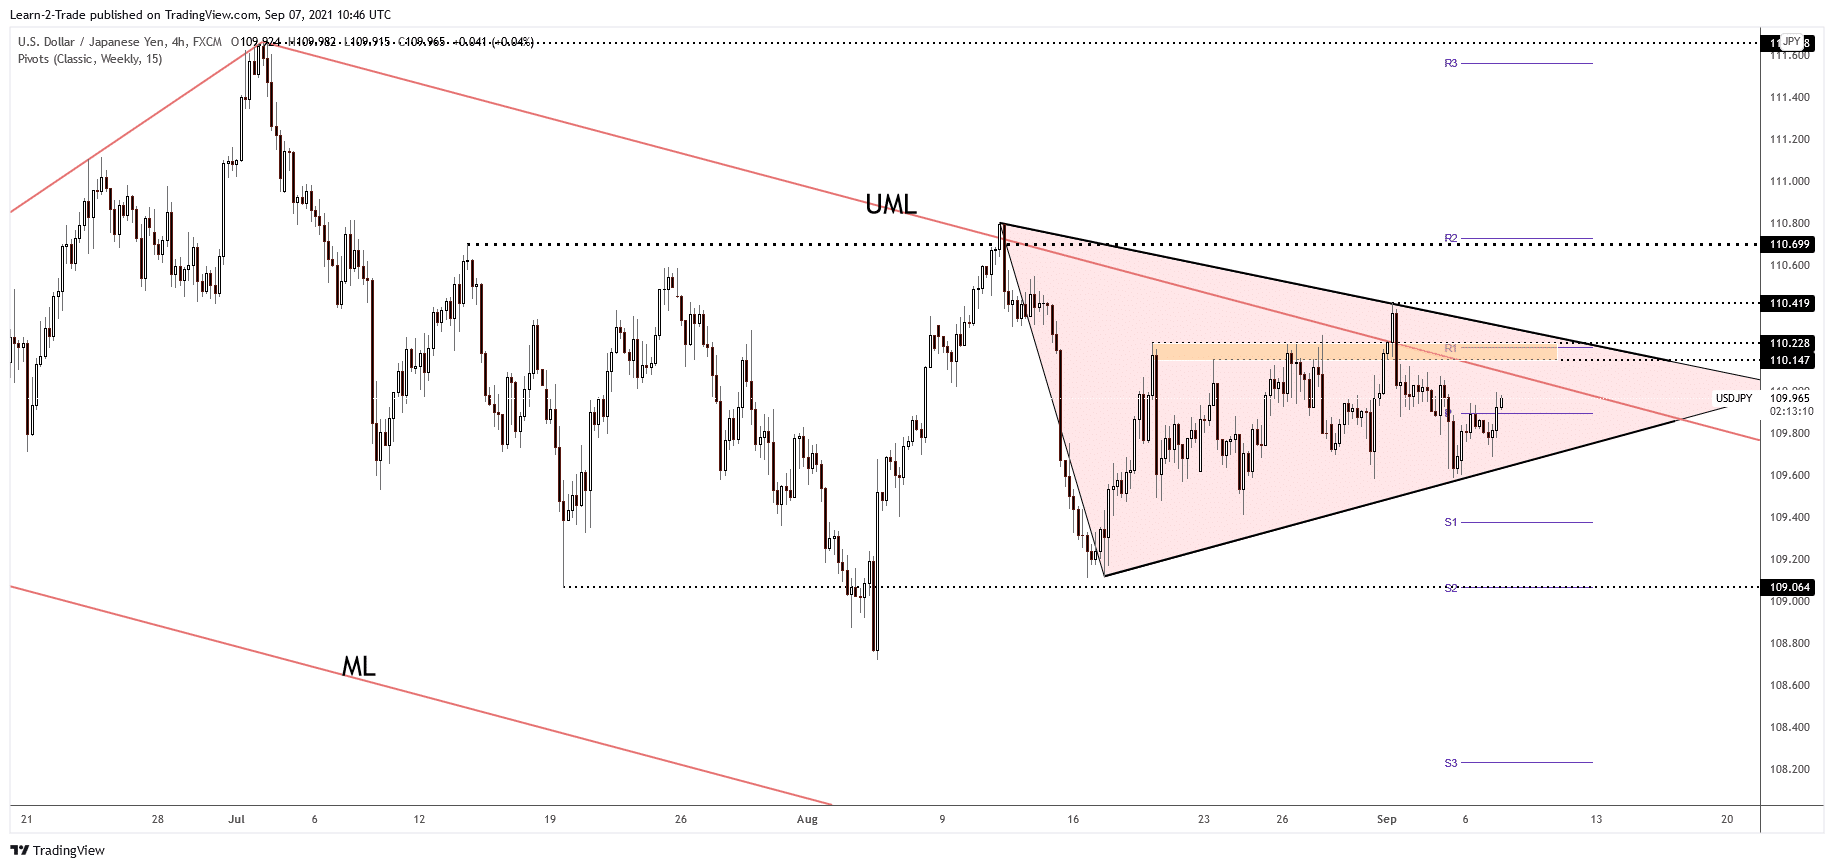
The USD/JPY pair has managed to jump above the weekly pivot point (109.89), and it may test the descending pitchfork’s upper median line (UML) again. However, it continues to stay under a major resistance area, so the pressure is still high.
–Are you interested to learn more about forex signals? Check our detailed guide-
Only a valid breakout through the falling trendline, the triangle’s resistance, could activate an upside movement. Technically, it may fall anytime again as long as it stays below the upper median line (UML) and under the 110.14 – 110.22 resistance area.
A downside movement could be signaled by a valid breakdown below the triangle’s support. Also, false breakouts above the upside obstacles could announce a new downside movement. Personally, I believe that a valid breakout through the 110.41 former high could activate a broader upside movement towards the 111.65 level.
Looking to trade forex now? Invest at eToro!
67% of retail investor accounts lose money when trading CFDs with this provider. You should consider whether you can afford to take the high risk of losing your money.
