- USD/JPY could escape from the current triangle pattern soon.
- Its most recent false breakout could signal a potential downside movement.
- Escaping from its current range movement could bring us a clear direction.
The USD/JPY price is trading in the red at 109.55 at the time of writing, and it seems very heavy. Further drop is imminent as long as the Dollar Index and Nikkei will resume their sell-off. The price has moved sideways lately, so we’ll have to wait for a fresh opportunity.
–Are you interested to learn more about low spread forex brokers? Check our detailed guide-
Despite the current drop, the USD/JPY pair could turn to the upside anytime again if it stays above major support levels. However, the US Dollar is under strong selling pressure as the Dollar Index is into a short-term corrective phase.
Unfortunately, the Greenback has taken a hit from the US Flash Manufacturing PMI and Flash Services PMI data. Today, the US is to release the New Home Sales, which could increase from 676K to 698K, but I don’t think it will have an important impact.
On the other hand, the Japanese Yen is bullish only because the Nikkei (JP225) drops after an amazing rally. The BOJ Core CPI increased by 0.2%, beating 0.1% expected 0.1% growth in the previous reporting period. Let’s hope that the United States Prelim GDP will bring us a clear direction on Thursday.
USD/JPY price technical analysis: Looking to break the triangle
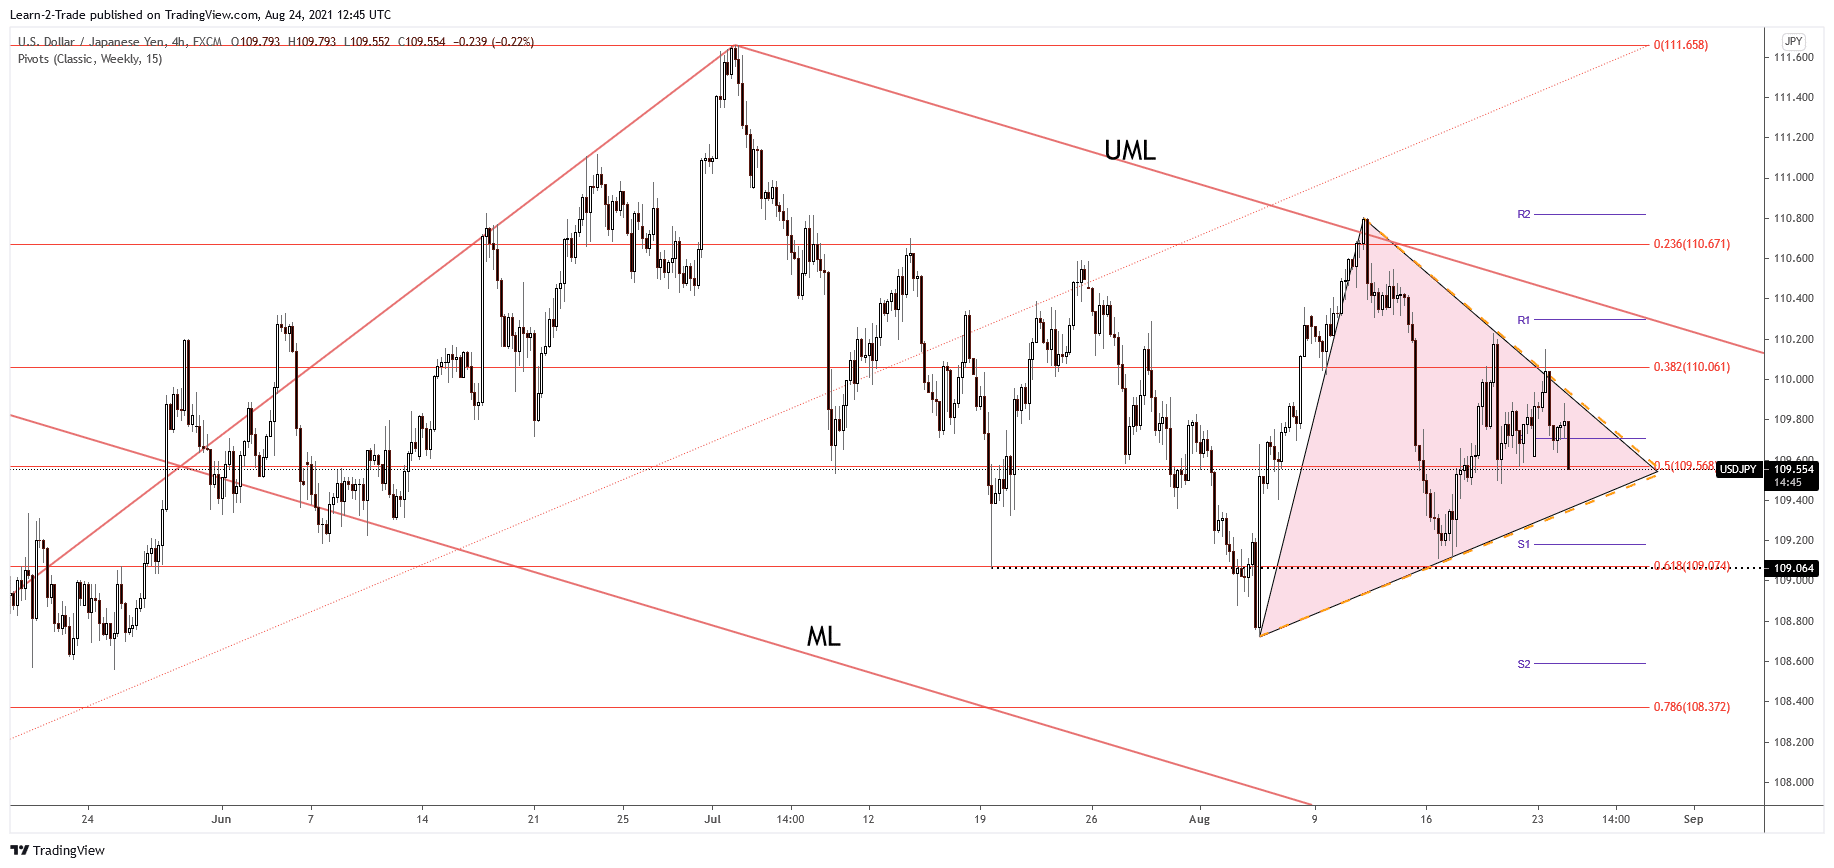
The USD/JPY price has found strong resistance at the 38.2% retracement level and the triangle’s resistance. It has printed only a false breakout, signaling strong sellers in the short term. It has dropped below the weekly pivot point of 109.70. A valid downside breakout from this pattern could signal further decline, while an upside breakout could indicate potential growth.
–Are you interested to learn more about forex signals? Check our detailed guide-
The USD/JPY pair has gained a little at the moment of writing only because DXY and JP225 have recovered. As you can see on the H4 chart, the price is trapped between the 38.2% and the 61.8% retracement levels. A valid breakout from this range could bring fresh opportunities. Technically, the last false upside breakout signalled a potential downside breakout.
Looking to trade forex now? Invest at eToro!
67% of retail investor accounts lose money when trading CFDs with this provider. You should consider whether you can afford to take the high risk of losing your money.
