- The USD/JPY pair could drop anytime if it stays under the downtrend line.
- Activating the flag pattern may announce a new downside movement.
- Yen Futures’ drop forced the Yen to depreciate.
The USD/JPY price rallied in the short term, trying to recover after its recent strong bearish momentum. The pair is trading at 134.01, below today’s high of 134.40.
–Are you interested to learn more about forex signals? Check our detailed guide-
The USD dragged the price higher even if the Dollar Index remained sluggish. Still, the price rebounded as the Japanese Yen Futures’ sell-off weakened the Yen. Fundamentally, the Japanese SPPI reported a 1.7% growth on Monday, and the Unemployment Rate and BOJ Core CPI came in better than expected yesterday. In contrast, Housing Starts and Retail Sales indicators reported worse than expected data.
The greenback received a helping hand from the Goods Trade Balance, HPI, and the S&P/CS Composite-20 HPI yesterday. The economic indicators reported positive data.
Today, the BoJ Prelim Industrial Production reported a 0.1% drop versus the 0.2% drop expected after the 3.2% drop in the previous reporting period.
The US Pending Home Sales are expected to register a 0.9% drop in the last month, while the Richmond Index could remain deep in the negative territory at -10 points. Tomorrow, the US Unemployment Claims indicator is an important event that could increase the price.
USD/JPY price technical analysis: Flag formation
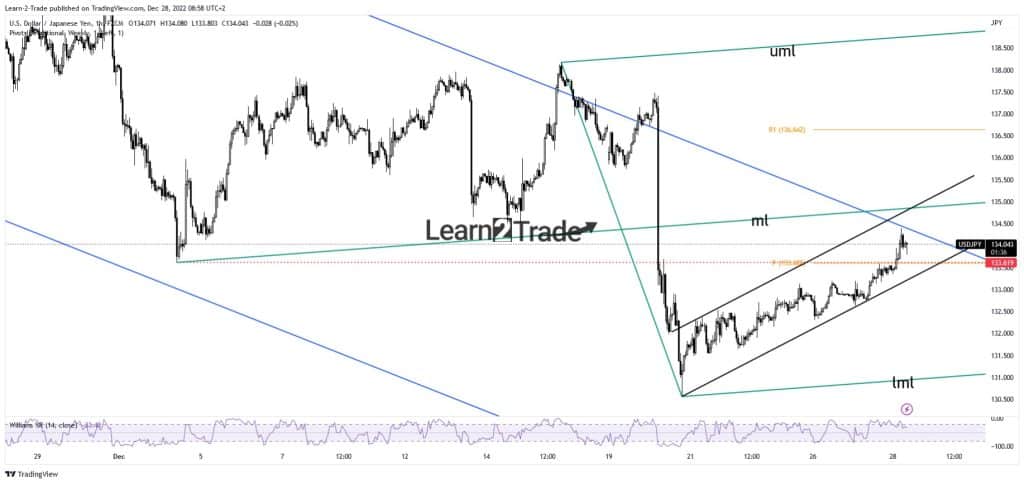
From a technical point of view, the USD/JPY pair rebounded. It was almost to hit the descending trendline. This represents a dynamic resistance, so the price could drop again if it stays under this obstacle.
–Are you interested to learn more about low spread forex brokers? Check our detailed guide-
Actually, the price action developed a bearish pattern. The flag formation could result in a new leg down. Still, it’s premature to talk about this scenario if the price is above the ascending trendline. The 133.61 and the weekly pivot point of 133.60 represent support levels.
The median line (ML) of the ascending pitchfork and the channel’s upside line also represents upside obstacles. The uptrend line is seen as critical support. A valid breakdown below this line, activating the flag pattern, could announce a new sell-off. The lower median line (LML) could represent a potential downside target.
Looking to trade forex now? Invest at eToro!
67% of retail investor accounts lose money when trading CFDs with this provider. You should consider whether you can afford to take the high risk of losing your money.
