The Canadian dollar reversed directions last week and gained 120 points. USD/CAD closed the week just above the 1.30 level. This week’s highlight is Employment Change. Here is an outlook on the major market-movers and an updated technical analysis for USD/CAD.
The Canadian economy is in trouble. GDP, released monthly, posted a sharp drop of 0.6%. This marked the third contraction in four months. In the US, the Fed was cautiously optimistic but did not provide any hints regarding the timing of a rate hike. The US dollar lost ground in response to a soft GDP report, which climbed just 1.2%, well short of the estimate of 2.6%.
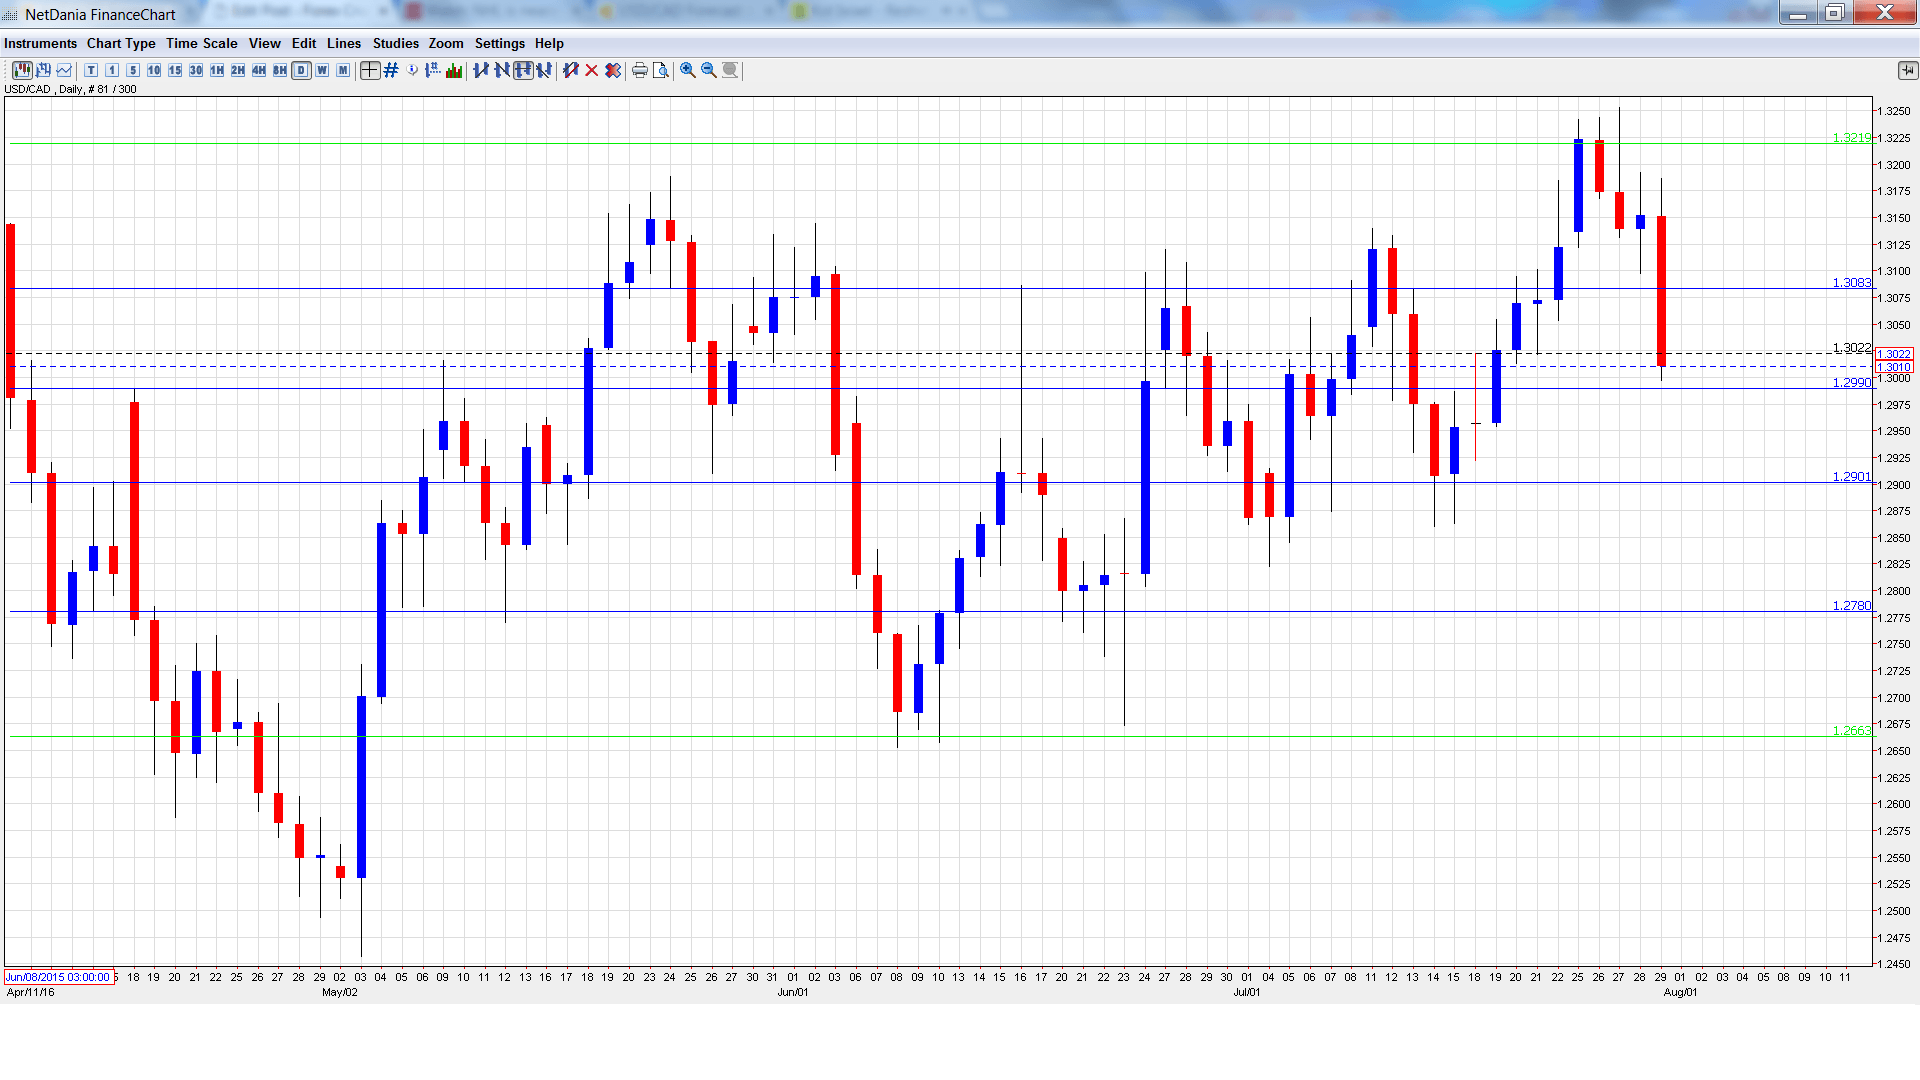
USD/CAD daily graph with support and resistance lines on it. Click to enlarge:
- RBC Manufacturing PMI: Tuesday, 13:30. The PMI continues to post readings slightly above the 50 line, pointing to slight expansion. The June reading came in at 51.8 points.
- Employment Change: Friday, 12:30. Employment Change is one of the most important indicators and an unexpected reading can have a strong impact on the movement of USD/CAD. The indicator disappointed in June, posting a negligible loss of 0.7 thousand. The markets are expecting a sharp turnaround in the June reading, with an estimate of 10.2 thousand. The Unemployment Rate is expected to edge higher, from 6.8% to 6.9%.
- Trade Balance: Friday, 12:30. Trade Balance is closely connected to currency demand. In May, the deficit widened to C$3.3 billion, well above the forecast of C$2.6 billion. The markets are expecting an improvement in June, with an estimate of a deficit of C$2.6 billion.
- Ivey PMI: Friday, 14:00. The indicator improved to 51.7 points in May, beating the forecast of 50.2 points. Little change is expected in the June release.
USD/CAD opened the week at 1.3136 and touched a high of 1.3253. Late in the week, the pair dipped to a low of 1.2997, as support held at 1.2990 (discussed last week). The pair closed the week at 1.3010.
Live chart of USD/CAD:
Technical lines, from top to bottom
We begin with resistance at 1.3457.
1.3353 is next.
1.3219 was a cap in April.
1.3081 has switched to a resistance line following losses by USD/CAD.
1.2990 held firm as the pair briefly dropped below the 1.30 level.
1.2900 is the next support line.
1.2780 has provided support since late June.
1.2663 is the final support line for now.
I am bullish on USD/CAD
In the US, the GDP report was disappointing, but US numbers have been generally solid and some strong numbers will likely renew speculation about a rate hike.
Our latest podcast is titled A grounded chopper, slow-mo growth, and an unreliable BOE boyfriend?
Follow us on Sticher or on iTunes
Further reading:
- For a broad view of all the week’s major events worldwide, read the USD outlook.
- For EUR/USD, check out the Euro to Dollar forecast.
- For the Japanese yen, read the USD/JPY forecast.
- For GBP/USD (cable), look into the British Pound forecast.
- For the Australian dollar (Aussie), check out the AUD to USD forecast.
- For the kiwi, see the NZDUSD forecast.
