USD/CAD jumped close to 200 points, as the pair closed at 1.3536. This marked its highest level since the end of February. This week’s highlights are Manufacturing Sales and Core CPI. Here is an outlook on the major market-movers and an updated technical analysis for USD/CAD.
It was a tumultuous week in the markets, following Donald Trump’s stunning election win. The Canadian dollar, a risk currency, was steamrolled by the US dollar. There were no major Canadian indicators last week. Update: USD/CAD at highest since February – 3 reasons and levels. The loonie seems to have regained some ground as the dollar took a breather and Canadian manufacturing sales beat expectations.
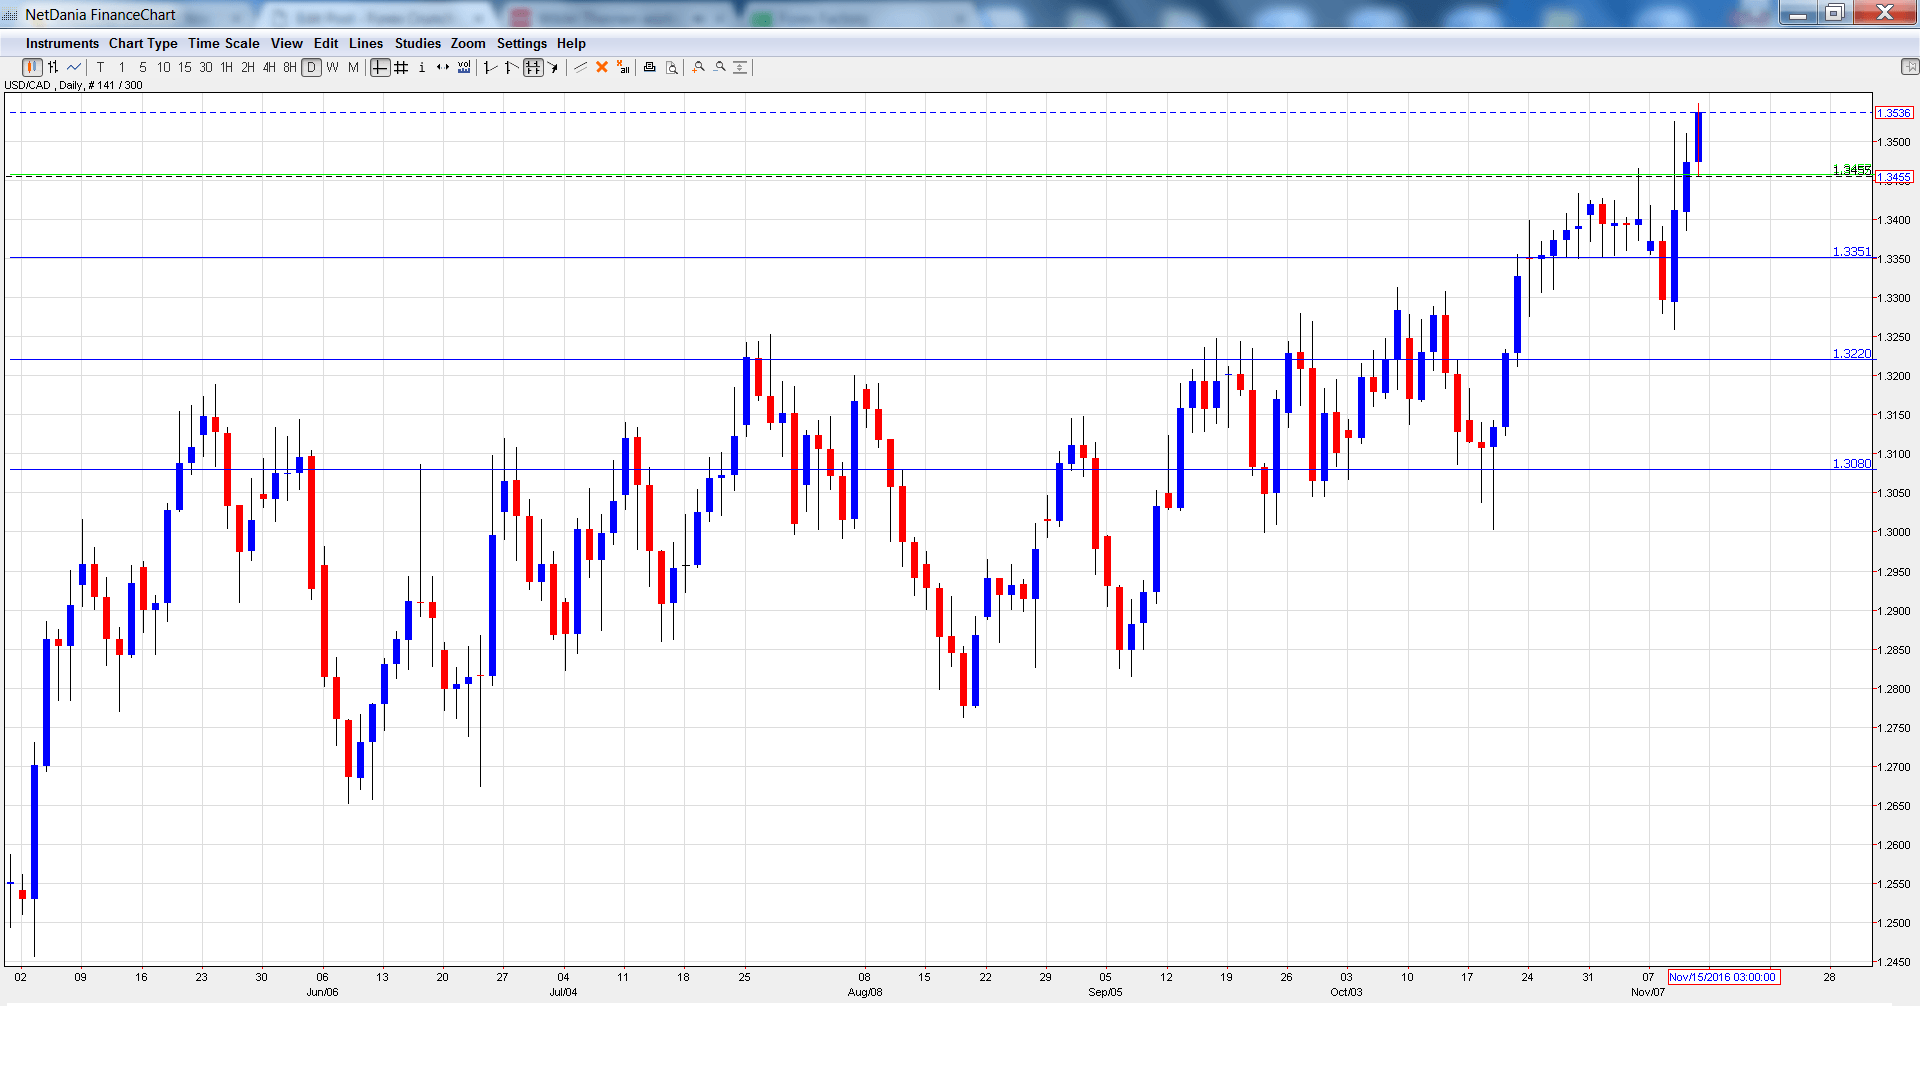
[do action=”autoupdate” tag=”USDCADUpdate”/]USD/CAD daily graph with support and resistance lines on it. Click to enlarge:
- Manufacturing Sales: Wednesday, 13:30. Estimate -0.2%. The week kicks off with this key event. In August, the indicator rebounded with a strong reading of 0.9%, well above the forecast of 0.3%. The markets are expecting a downturn in September, with the estimate standing at -0.2%.
- BoC Governor Timothy Lane Speech: Wednesday, 17:05. Lane will deliver remarks at an event in Waterloo, Ontario. A speech which is more hawkish than expected is bullish for the Canadian dollar.
- Foreign Securities Purchases: Thursday, 13:30. The indicator jumped in August, posting a gain of C$12.74 billion. This figure was well above the forecast of C$6.24 billion. Will the upward trend continue in September?
- BoC Review: Thursday, 15:30. This minor release includes articles about the economy and the central bank. It is not expected to have much impact on the movement of USD/CAD.
- Core CPI: Friday, 13:30. Core CPI excludes the most volatile items which comprise CPI. The index improved to 0.2% in September, matching the forecast. The upswing is expected to continue in October, with an estimate of 0.3%.
- CPI: Friday, 13:30. CPI improved to 0.1% in September, but this was shy of the estimate of 0.2%. The estimate for October remains unchanged at 0.2%.
USD/CAD opened the week at 1.3359 and dropped to a low of 1.3259. USD/CAD then reversed directions and climbed to a high of 1.3548, testing resistance at 1.3551 (discussed last week). The pair closed the week at 1.3536.
Live chart of USD/CAD:
Technical lines, from top to bottom
We begin with resistance at 1.3911.
1.3813 was a cushion in January and February.
1.3672 is next.
1.3551 has provided resistance since March.
1.3457 is an immediate support level. This line was a cap in September 2015.
1.3351 is next.
1.3219 was a cap in April.
1.3081 is the final support line for now.
I remain bullish on USD/CAD
The US dollar posted broad gains after the stunning Trump victory. The greenback could continue to rally against a weak Canadian dollar, which is also being pushed down by weaker oil prices.
Our latest podcast is titled Trump-time – fiscal, monetary and market implications
Follow us on Sticher or iTunes
Safe trading!
Further reading:
- For a broad view of all the week’s major events worldwide, read the USD outlook.
- For EUR/USD, check out the Euro to Dollar forecast.
- For the Japanese yen, read the USD/JPY forecast.
- For GBP/USD (cable), look into the British Pound forecast.
- For the Australian dollar (Aussie), check out the AUD to USD forecast.
- For the kiwi, see the NZDUSD forecast.
