EUR/USD traded on high ground but eventually returned to the same place. The big event ahead of us is undoubtedly the ECB decision. Here is an outlook for the highlights of this week and an updated technical analysis for EUR/USD.
Euro-zone data fell short of expectations: with German confidence falling sharply, a narrower trade surplus and a reminder of poor inflation, things don’t look good. The ECB also stepped up its game regarding inflation and further action: a comment by Nowotny showed us that the central bank does not like a strong currency. In the US, the poor retail sales certainly hurt the greenback, but it made a comeback with good inflation data. The ugly contest continues.
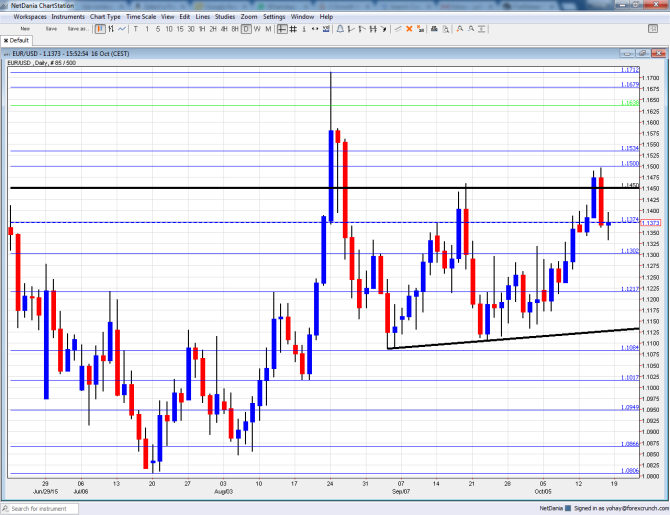
[do action=”autoupdate” tag=”EURUSDUpdate”/]EUR/USD daily graph with support and resistance lines on it. Click to enlarge:
- Bundesbank monthly report: Monday, 10:00. Germany’s powerful central bank publishes a wide assessment of the economy on a monthly basis, with outlooks for inflation, employment and more. It will be interesting to watch whether the VW scandal will make its way into the publication and if Jens Weidmann and his colleagues will fear of the negative consequences.
- German PPI: Tuesday, 6:00. Producer prices make their way into consumer prices, so this provides an indication. After prices fell 0.5% in August, another drop is on the cards for November: -0.1%.
- Current Account: Tuesday, 8:00. Thanks to German exports, the euro-area has a positive balance, with a surplus of 22.6 billion seen in July. A slightly lower figure could be seen in August: 20.1 billion is expected.
- Rate decision: Thursday: decision at 11:45, press conference at 12:30. No policy change is expected this time, with the interest rate remaining at 0.05%, the deposit rate at -0.20% and the QE program unchanged at €60 billion / month through September 2016. However, given the deterioration in several economic indicators in the euro-zone, the trouble in China and the rise of the exchange rate, there is speculation that the ECB will hint about action in its December 2016 meeting, when new forecasts are issued. Recent comments showed hesitation to do more, but nothing is certain.
- Consumer Confidence: Thursday, 14:00. This official figure from Eurostat has shown ongoing pessimism among European consumers, with -7 points in September for the third consecutive month. Can it dig deeper? A repeat of -7 is predicted.
- Flash PMIs: Friday: 7:00 for France, 7:30 for Germany and 8:00 for the whole euro-zone. Markit’s initial purchasing managers’ reads for October will reflect the mood in the largest economies. France saw its manufacturing sector at 50.6 points in September, just above the 60 point mark separating growth from contraction. A score of 50.2 is on the cards. The services sector is doing better with 51.9 points. The same figure is expected. Germany, the zone’s powerhouse, had manufacturing at 52.2 points and services at 54.1 points. Slides to 51.8 and 54 are on the cards. The whole euro-zone saw 52 and 53.7 points in manufacturing and services respectively and now scores of 51.8 and 53.6 are expected. Manufacturing figures carry more weight, even though these are smaller sectors in developed economies.
- Belgian NBB Business Climate: Friday, 13:00. While this indicator comes from a small country, it serves as a bellwether for the wider EZ economy. The last level that was seen was -6.8 points in September, reflecting worsening conditions. A similar level of -6.6 is predicted.
* All times are GMT
EUR/USD Technical Analysis
Euro/dollar started the week with a move above the 1.1375 level (mentioned last week). It then made the break above 1.1460, but this turned into a false break and the pair was rejected at 1.15, falling a lot.
Live chart of EUR/USD: [do action=”tradingviews” pair=”EURUSD” interval=”60″/]
Technical lines from top to bottom:
1.1875 was the low seen in 2010 and also capped the pair earlier this year. The August high of 1.1712 is the next line.
1.1680 capped the pair in January on its way down. The next line is a clear separator of ranges: 1.1535. It was last seen in January as well.
The very round 1.15 level is of importance thanks to its psychological role. It is closely followed by 1.1460 that served as resistance earlier in the year, twice.
The historic line of 1.1373 (from November 2003) still has a role as resistance, but it is certainly weakening. 1.13, the round number, showed its strength in capping a recovery attempt in early September.
1.1215, which capped the pair both in June and in August is clear resistance. It is followed by a low seen in January of 1.1113 which is nearly 0.90 on USD/EUR.
1.1050 returns to the chart after serving as a stepping stone for the pair to rise to higher ground. 1.0950 is a pivotal line in the range.
1.0865 provided some support in late May and is weak support before a stronger line: 1.0810, which was the bottom in July also nicely coincides with the low seen in May and is strong support..
The next line is 1.0760, which was the low point in both July and August 2003. 1.0715 joins the chart after temporarily capping the pair in April 2015.
I am bearish on EUR/USD
You can certainly trust the ECB to strike back and not allow the euro to rise too high. We will probably see a repeat of this on center stage: the rate decision. Even if the US is moving away from a rate hike in 2015, the euro-zone continues doing worse, and we can expect it to be reflected in the exchange rate.
In our latest podcast we analyze Varoufakis’ 4 problems and 4 solutions, and more
Follow us on Sticher or on iTunes
Further reading:
- For a broad view of all the week’s major events worldwide, read the USD outlook.
- For the Japanese yen, read the USD/JPY forecast.
- For GBP/USD (cable), look into the British Pound forecast.
- For the Australian dollar (Aussie), check out the AUD to USD forecast.
- USD/CAD (loonie), check out the Canadian dollar forecast
- For the kiwi, see the NZDUSD forecast.
