The British pound dropped to its lowest level in almost seven years, but closed the week unchanged, at 1.4260. This week’s highlight is Preliminary GDP. Here is an outlook on the major events moving the pound and an updated technical analysis for GBP/USD.
In the US, inflation numbers were within expectations, but Unemployment Claims surged to their highest level in 11 months. In the UK, last week’s numbers did not impress. Inflation levels remain weak, and Retail Sales posted a sharp drop.
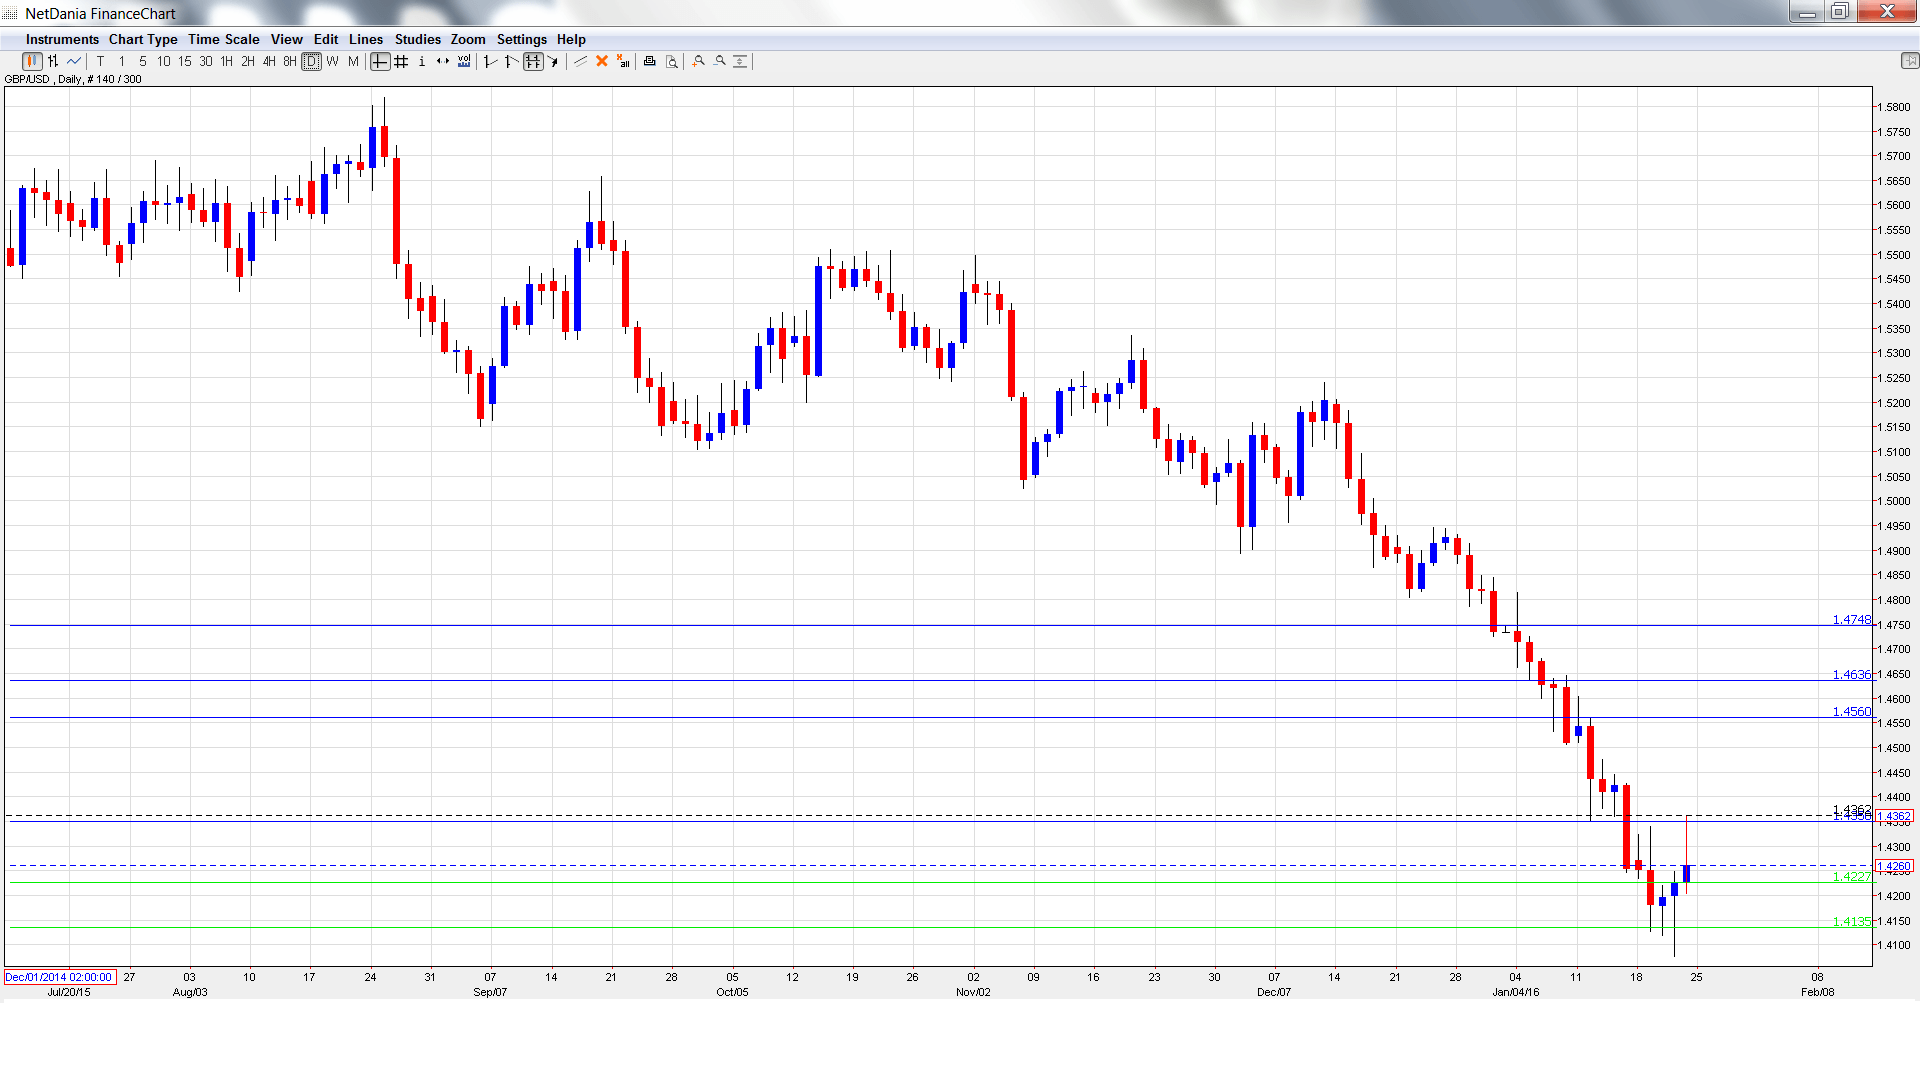
[do action=”autoupdate” tag=”GBPUSDUpdate”/]GBP/USD graph with support and resistance lines on it. Click to enlarge:
- CBI Industrial Order Expectations: Monday, 11:00. This indicator has looked awful, posting eight straight declines. No relief is expected in the January report, with the estimate standing at -10 points.
- BOE Governor Mark Carney Speaks: Tuesday, 10:45. Carney will speak on the Financial Stability Report before the Treasury Select Committee in London. The markets will be listening closely for hints regarding the BOE’s future interest rate policy.
- Nationwide HPI: Wednesday, 7:00. This index provides a snapshot of the level of activity in the UK housing sector. The indicator posted a solid gain of 0.8% in December, beating the forecast of 0.4%. The estimate for the January report stands at 0.6%.
- BBA Mortgage Approvals: Wednesday, 9:30. This housing indicator has been quite steady, posting a gain of 45.0 thousand in November, which was shy of the forecast of 46.2 thousand. Little change is expected in December, with an estimate of 45.5 thousand.
- Preliminary GDP: Thursday, 9:30. GDP is one of the most important indicators and should be treated as a market-mover. Final GDP for Q3 posted a gain of 0.4%, which was within expectations. The estimate for Preliminary GDP for Q4 stands at 0.5%.
- CBI Realized Sales: Thursday, 11:00. This event is a leading indicator of consumer spending, a key driver of economic growth. The indicator surged to 19 points, indicative of a strong increase in sales volume. This reading was shy of the forecast of 22 points. Little change is expected in January, with an estimate of 18 points.
- GfK Consumer Confidence: Friday, 00:05. The indicator has been steady in recent readings, and edged up to 2 points in December. Little movement is expected in the January report, with an estimate of 1 point.
* All times are GMT
GBP/USD Technical Analysis
GBP/USD opened the week at 1.4271 and dropped to a low of 1.4076. The pair then rebounded and climbed to a high of 1.4362, testing resistance at 1.4346 (discussed last week). GBP/USD closed the week at 1.4260.
Technical lines from top to bottom
We begin with resistance at 1.4635.
1.4562 remains a strong resistance line.
1.4346 is the next resistance line. It was tested as the pair posted strong gains before retracting.
1.4227 is providing weak support and could see further action early in the week.
1.4135 is the next support level. This line marked a low point in December 2001.
The symbolic level of 1.40 is next. It was last breached in March 2009.
1.3809 was a cushion in February 2009.
1.3678 is the final support line for now.
I am bearish on GBP/USD.
The Federal Reserve may not raise rates for a while, but the safe-haven greenback has benefited from market jitters in early 2016. With the US economy outperforming that of the UK, there is room for the pound to lose ground and possibly slip below the symbolic 1.40 level.
In our latest podcast we update from the currency war front
Follow us on Sticher or on iTunes
Further reading:
- For a broad view of all the week’s major events worldwide, read the USD outlook.
- For EUR/USD, check out the Euro to Dollar forecast.
- For the Japanese yen, read the USD/JPY forecast.
- For the kiwi, see the NZD/USD forecast.
- For the Australian dollar (Aussie), check out the AUD to USD forecast.
- For the Canadian dollar (loonie), check out the USD to CAD forecast.
