The Canadian dollar enjoyed the weakness of the greenback and reached a 7 month high. We will now see how the Canadian economy is doing with key indicators. GDP and Ivey PMI are the major events this week. Here’s an outlook for the Canadian events and an updated technical analysis for USD/CAD.
Last week, a slowdown in car sales led to an unexpected drop of 0.2% in Canada’s February retail sales following a 0.2% gain in January. In the meantime core sales, excluding the auto sector, gained 0.5%, lower than the 0.6% increase predicted. The loonie didn’t suffer from the softer than expected GDP figures in the US. The US consumer is still active enough to support the Canadian economy.
Updates: USD/CAD is showing little change, trading at 0.9817. We could see some movement by the pair following the release of GDP later on Monday. GDP was a big disappointment, as the key indicator declined by 0.2%, its lowest reading in 2012. The markets had forecast an increase of 0.2%. The loonie has lost ground against its US counterpart, trading at 0.9876. The pair is moving in a narrow range, and was trading at 0.9871. We could see some movement by the loonie following the release of PMI, a key indicator, on Friday. The markets are predicting a reading of 64.2, a slight increase from the April reading. The loonie lost some ground, as USD/CAD was trading at 0.9830.
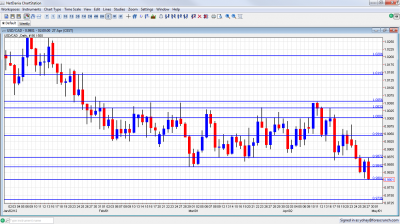
USD/CAD daily chart with support and resistance lines on it. Click to enlarge:
- GDP: Monday, 12:30. Canadian economy growth slowed to 0.1% in January following a sharp 0.5% climb in December amid declines in energy products extraction. This reading was in line with economists expectations. The manufacturing sector hurt from the US recession climbed 0.7% but is still below mid-2008 levels. Canadian economy is expected to expand 0.2% this time.
- RMPI : Monday, 12:30. The Raw Materials Price Index dropped 0.5% in February, following a moderate increase of 0.2% in January. The main cause for this decline was a drop in mineral fuels and crude petroleum. Meanwhile, Industrial Product Price Index (IPPI) climbed 0.2% due to a rise in petroleum and coal products and primary metals. RMPI is predicted to gain 0.5% while IPPI is anticipated to increase 0.3%.
- Ivey PMI: Friday, 14:00. The March Canadian Ivey Purchasing Managers Index declined to63.5 in March after rising to66.5 in February. This is the first drop in five months but the overall figures reflect expansion. An increase to 64.2 is expected this time.
* All times are GMT.
USD/CAD Technical Analysis
Dollar/CAD started the week with a small attempt to rise, but fell short of parity. It then started a descent downwards and traded between 0.98 and 0.9870, lines that didn’t appear last week. It eventually closed on the lower side, at 0.9801.
Technical lines, from top to bottom:
1.0263 is the peak of surges during the last quarter of 2011, but was damaged after the move higher. It’s far at the moment. The round figure of 1.02 was a cushion when the pair dropped in November, and also the 2009 trough. It is weaker now but remains pivotal.
1.0143 was a swing low in September and worked as resistance several times afterwards. In the battle lines around parity, 1.0050 was tough resistance in April 2012. Very close by, 1.0030 capped the pair twice in March 2012 and is stronger after a successful challenge in April 2012.
The very round number of USD/CAD parity is a clear line of course, and the battle seems to be over for now, after another attempt to rise ended in a big downfall. Under parity, we meet another pivotal line at 0.9950. It served as a top border to range trading in March 2012 and later as a line in the middle of the range.
0.9870 was a trough reached once and challenged afterwards, and serves a bottom border of the range. It capped the pair on recovery attempts in April 2012. 0.9840 provided support for the pair during September and was reduced to a minor line now.
The round number of 0.98 is key support that was tested twice during the downfall. It’s strong. The next line is 0.9736, which provided support during August 2011.
The veteran 0.9667 line worked as support at the beginning of 2011 and then for several months during the spring. It is a very clear and strong line on the chart.
I remain bearish on USD/CAD.
The demand from the US consumer, together with strong with strong domestic employment figures and hawkishness from the BOC keep the loonie strong. As long as local GDP continues growing and the US NFP isn’t a disaster, the pair could fall even lower.
Further reading:
- For a broad view of all the week’s major events worldwide, read the USD outlook.
- For EUR/USD, check out the Euro to Dollar forecast.
- For the Japanese yen, read the USD/JPY forecast.
- For GBP/USD (cable), look into the British Pound forecast.
- For the Australian dollar (Aussie), check out the AUD to USD forecast.
- For the New Zealand Dollar (kiwi), read the NZD forecast.
- For USD/CAD (loonie), check out the Canadian dollar forecast
- For the Swiss Franc, see the USD/CHF forecast
