AUD/USD reversed directions last week, gaining 80 points. The pair closed at 0.7117. This week’s key event is the RBA Monetary Policy Meeting Minutes. Here is an outlook on the major market-movers and an updated technical analysis for AUD/USD.
The Australian dollar received a strong boost from surprisingly strong Australian employment numbers. The US posted mixed numbers last week. PPI and Retail Sales missed estimates, but UoM Consumer Sentiment beat the forecast. Earlier in the week, US jobless claims repeated at 276 thousand, coming in above the forecast for a second straight week. The Fed is leaning towards a hike, but is not yet fully committed to the move.
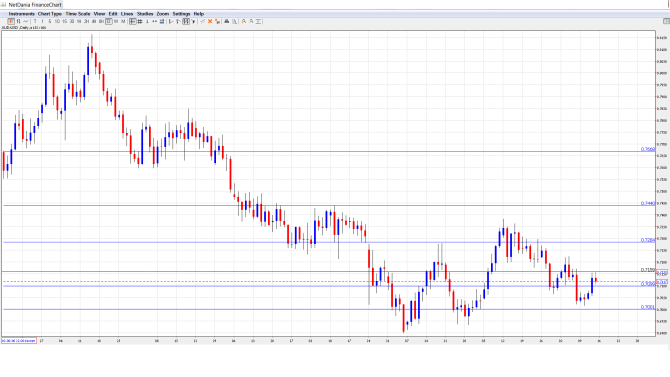
[do action=”autoupdate” tag=”AUDUSDUpdate”/]AUD/USD graph with support and resistance lines on it. Click to enlarge:
- New Motor Vehicle Sales: Monday, 00:30. This indicator provides a gauge of the strength of consumer spending. After two straight declines, the indicator reversed directions in September and posted an excellent gain of 5.5%.
- RBA Assistant Governor Christopher Kent Speaks: Monday, 21:30. Kent will speak at a conference in Sydney. The markets will be looking for clues regarding the RBA’s future monetary policy.
- RBA Monetary Policy Meeting Minutes: Tuesday, 00:30. This indicator, released monthly, is a key event. The indicator posted a strong improvement in September, rising to 5 points. Will the upward trend continue in the October report?
- RBA Assistant Governor Guy Debelle Speaks: Tuesday, 22:15. Debelle will speak at an event in Sydney. A speech which is more hawkish than expected is bullish for the Australian dollar.
- CB Leading Index: Tuesday, 23:00. The index has shown some movement, alternating between gains and losses. The indicator posted a decline of -0.4% in September, marking its sharpest decline since August 2012. The
- MI Leading Index: Tuesday, 23:30. This index is composed of 9 indicators, but is a minor event, as most of the data has already been released. The indicator improved in September, posting a small gain of 0.1%. This marked the index’s first gain in four months.
- Wage Price Index: Wednesday, 00:30. Wage Price Index is a leading indicator of consumer inflation, and is released on a quarterly basis. The index has been quite steady, and posted a respectable gain of 0.6% in Q3. An identical gain of 0.6% is expected in the Q4 release.
* All times are GMT.
AUD/USD Technical Analysis
AUD/USD started the week at 0.7037 and slipped to a low of 0.7015. The pair then reversed directions and climbed to 0.7159, just shy of resistance at 0.7160 (discussed last week). The pair closed at 0.7117.
Live chart of AUD/USD: [do action=”tradingviews” pair=”AUDUSD” interval=”60″/]
Technical lines from top to bottom:
0.7664 is a strong resistance line.
0.7440 capped the pair back in August, and remains key resistance.
0.7284 is the next resistance line.
0.716o held firm as the pair almost touched this line before retracting.
The round number of 0.7100 is providing support.
The very round level of 0.70 worked as a cushion in August and is the next support level.
0.69 has provided support since September.
0.6775 is the final line for now. It has provided support since March 2009.
I am bearish on AUD/USD
The recent Nonfarm Payrolls has increased the likelihood of a rate hike, and this week’s CPI report and Fed minutes will be closely scrutinized by the markets. A improvement in inflation would bolster the case for a rate hike in December, so the Aussie will likely take a hit in this scenario.
In our latest podcast we discuss the December decision driving the dollar, declining oil and more:
Follow us on Sticher or on iTunes
Further reading:
- For a broad view of all the week’s major events worldwide, read the USD outlook.
- For EUR/USD, check out the Euro to Dollar forecast.
- For the Japanese yen, read the USD/JPY forecast.
- For GBP/USD (cable), look into the British Pound forecast.
- For the Canadian dollar (loonie), check out the Canadian dollar forecast.
- For the kiwi, see the NZD/USD forecast.
