- The GBP/USD pair could extend its sell-off if it makes a new lower low.
- The price action could develop a major Falling Wedge pattern.
- Breaking above the downtrend line may signal that the downside movement has ended.
The GBP/USD price moves sideways in the short term. The price developed a minor triangle pattern. It was around 1.2192 while writing. The bias remains bearish as the Dollar Index resumes its growth. DXY’s further growth could force the pair to approach and reach new lows.
–Are you interested in learning more about STP brokers? Check our detailed guide-
Fundamentally, the GBP took a hit from the UK data yesterday. That’s why a deeper drop is in the cards. The Prelim GDP rose by 0.8% less versus 1.0% expected, GDP dropped by 0.1% versus the 0.0% growth estimated, while the Goods Trade Balance came in at -23.9B versus -18.5B forecasts.
In addition, the Index of Services, Industrial Production, Manufacturing Production, and the Prelim Business Investment came in worse than expected. Only the Construction Output indicator came in better than expected. It has reported a 1.7% growth versus 0.2% estimates. Hence, the US data came in mixed.
Today, the US will release the Prelim UoM Consumer Sentiment, which is expected to drop from 65.2 points to 64.1 points. Better than expected data could help the USD to resume its appreciation.
GBP/USD price technical analysis: Triangle pattern
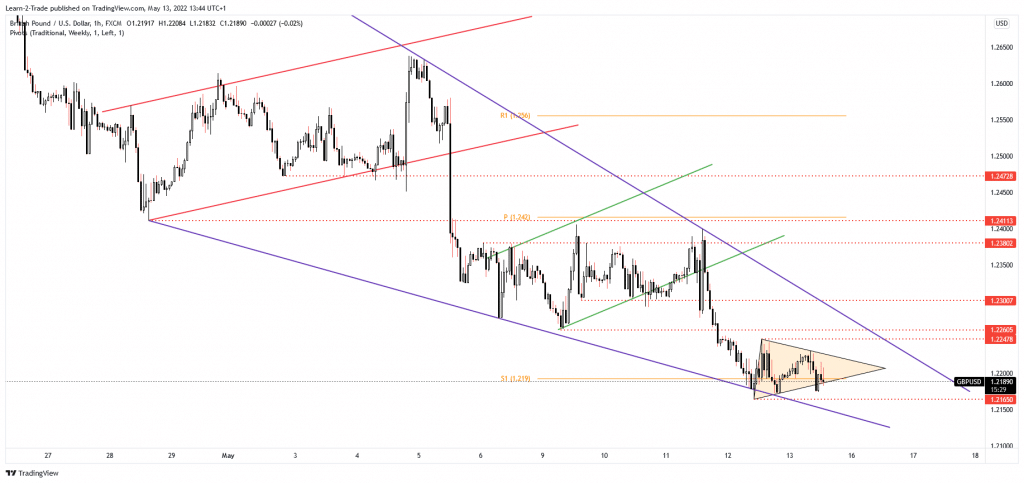
The GBP/USD pair resumed its sell-off after escaping from the previous flag patterns. Now, it has developed a minor triangle. It has registered a false breakdown and is now trying to rebound.
–Are you interested in learning more about making money with forex? Check our detailed guide-
Technically, the price action could print a major Falling Wedge pattern. Still, it’s premature to talk about this potential reversal pattern as long as the rate is far below the downtrend line. The 1.2165 former low stands as potential static support.
The GBP/USD pair is trapped between 1.2165 and 1.2247 levels. Escaping from this range could bring great trading opportunities. A new lower low, a bearish closure below 1.2165, could activate more declines. As long as it stays under the downtrend line, the GBP/USD pair could drop towards new lows.
Looking to trade forex now? Invest at eToro!
68% of retail investor accounts lose money when trading CFDs with this provider. You should consider whether you can afford to take the high risk of losing your money
