The New Zealand dollar dropped from the highs seen in the previous week. Is this a necessary correction or a change of course? More business confidence data awaits the kiwi this week. Here is an analysis of fundamentals and an updated technical analysis for NZD/USD.
The important ANZ Business Confidence dropped from the extremely high levels of 70.8 to the still very high figure of 67.3. Optimism is still strong, but it just can’t go higher, and can’t the kiwi. Building consents fell by 1.7% and didn’t help either. In the US, the Non-Farm Payrolls report was OK, but expectations just went too high. This enabled the kiwi to recover.
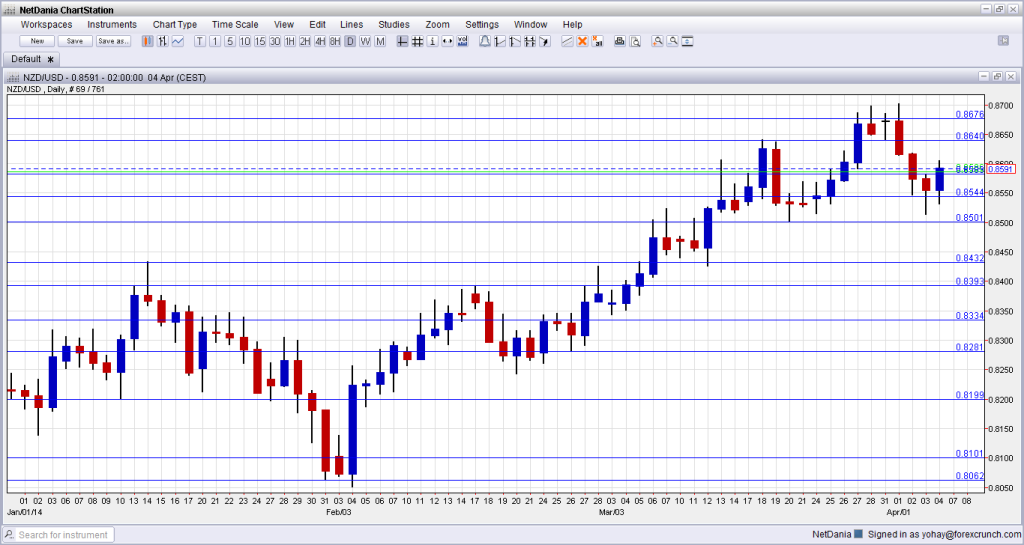
[do action=”autoupdate” tag=”NZDUSDUpdate”/]NZD/USD daily graph with support and resistance lines on it. Click to enlarge:
- REINZ HPI: Exact publication time unknown at the moment. This house price index from the Real Estate Institute of New Zealand made a monthly jump of 2.1% in February, erasing a previous drop. All in all, house prices are on the rise. Another gain is likely, but will probably be more moderate this time.
- Business NZ Manufacturing Index: Wednesday, 22:30. This PMI-like indicator has shown growth since late 2012 (a score above 50 points). The survey of manufacturers remained steady on high ground in February, at 56.2 points, and will likely tick a bit lower.
- FPI: Thursday, 22:45. As an exporter of food, the Food Price Index is an important figure. A surprising drop of 1% was recorded in February. This will likely be followed with an advance this time.
* All times are GMT.
NZD/USD Technical Analysis
Kiwi/dollar started the week with another attempt on the round 0.87 level mentioned last week. This turned into a double top, as the kiwi took a dive, initially finding support at the 0.8586 line before dropping even lower. The close above this line is certainly encouraging.
Technical lines, from top to bottom:
The multi year high of 0.8832 is not that far away. Below this level, we can mark the round number of 0.88 as minor resistance. Another minor line is the round 0.87 level.
The 2013 peak of 0.8676 is a strong line in the distance. The 2014 peak of 0.8640 is close by, and it is key to any upside moves.
It is followed by the stubborn May 2013 high of 0.8586 is another important line. The October peak of 0.8544 is an important resistance line.
0.85 is around number and could trigger comments by policymakers. A move above this line didn’t hold in early March 2014. 0.8435 was the peak in September and was retested in January. It is a strong double top.
0.8392 served as resistance was a recurring peak between November and February. 0.8335 capped a move higher in December and also had a role in the past. The pair fell short of this line in January 2014.
Below, 0.8280 supported the pair in February 2014 and also in the past. 0.82, worked as support several times: in September, October and also in December. It is somewhat weaker now.
I am neutral on NZD/USD
The rally seems to have run out of steam and could be followed by a period of consolidation before higher levels are challenged. The same pattern is seen in the ANZ figure. Economic strength in the US still does not match the strength of the economy in New Zealand, but momentum is picking up on the other side of the Pacific.
The kiwi is among the 5 most predictable currency pairs
Further reading:
- For a broad view of all the week’s major events worldwide, read the USD outlook.
- For EUR/USD, check out the Euro to Dollar forecast.
- For the Japanese yen, read the USD/JPY forecast.
- For GBP/USD (cable), look into the British Pound forecast.
- For the Australian dollar (Aussie), check out the AUD to USD forecast.
- For USD/CAD (loonie), check out the Canadian dollar forecast.
