The New Zealand dollar managed to rise on its own good news and took advantage of the greenback’s weakness following the Draghi disappointment. The big event of the week is clearly the rate decision in New Zealand. Here is an analysis of fundamentals and an updated technical analysis for NZD/USD.
Dairy prices rose by 3.6%, breaking the losing streak that lasted two auctions. Together with another rise in business confidence, the kiwi enjoyed a move to the upside. In the US, data was OK, but the rate hike march continues. An indirect effect came from Europe: the surge in the euro following Draghi’s non-delivery weakened the US dollar and this was felt also in NZD/USD.
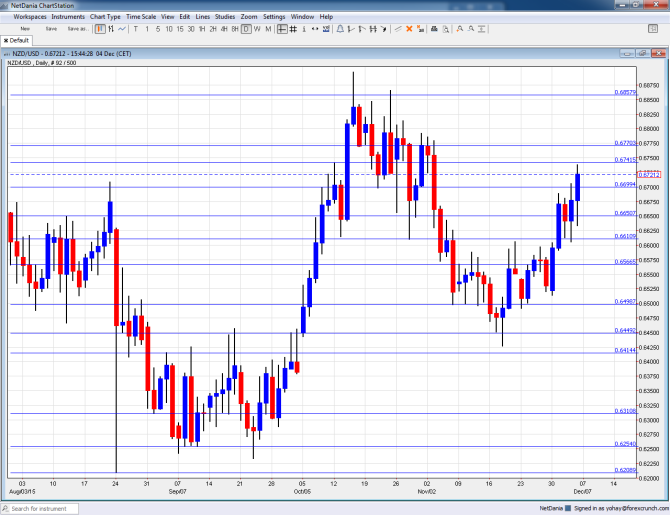
[do action=”autoupdate” tag=”NZDUSDUpdate”/]NZD/USD daily graph with support and resistance lines on it. Click to enlarge:
- Manufacturing Sales: Monday, 21:45. This official quarterly measure has bounced back from the lows in Q2, rising 0.4% after 4 consecutive falls.
- Rate decision: Wednesday, 20:00. The Reserve Bank of New Zealand left interest rates unchanged in its recent meeting, but certainly left the door open for a cut this time. Market expectations stand on a cut from 2.75% to 2.50% that will be followed by a pause. The reaction for NZD/USD depends on the accompanying statement and the press conference by governor Graeme Wheeler which begins 5 minutes after the announcement. Given the expectation for a Fed hike in the following week, we might see a cautious note from the RBNZ.
- Business NZ Manufacturing Index: Thursday, 21:30. This PMI-like release showed moderate growth in the manufacturing sector, with the score sitting on 53.3 points in October. A similar figure is on the cards for November.
- FPI: Thursday, 21:45. As an exporter of food, New Zealand depends on prices. While the figure is recently overshadowed by milk prices, it still has an impact. Prices dropped 1.2% in October.
NZD/USD Technical Analysis
Kiwi/dollar began the week within the range mentioned last week, before shooting higher and getting closer to 0.67. From there the pair slid south but recovered, eventually rising above 0.67 and hitting resistance at 0.6740.
Live chart of NZD/USD:
[do action=”tradingviews” pair=”NZDUSD” interval=”60″/]Technical lines, from top to bottom:
0.7075 is where the pair found support back May. It is naturally followed by the very round level of 0.70.
The low of 0.6940 allowed for a temporary bounce. The round 0.69 level has switched positions to resistance.
0.6860 was a low point as the pair dropped in June 2015. It is followed by the 0.68 level that worked as resistance when the pair was climbing a few years back.
Close by, the July high of 0.6770 serves as resistance. Quite close by, the high of 0.6740 seen in July is another cap.
It is followed by the round level of 0.67 that was a pivotal line in the high range. Another line worth noting is 0.6640, which capped the pair in November.
The post crisis low of 0.6560 is still of importance. Below, the round 0.65 level is of high importance now, serving as support.
I am bearish on NZD/USD
Monetary policy divergence looks clearer than ever, with an imminent cut in New Zealand and an imminent hike in the US. Despite some strength in the local economy, the RBNZ doesn’t want a strong NZD and will make a clear case for that.
Our latest podcast is about Expectations and Disappointments in EUR, USD and Oil
Follow us on Sticher or on iTunes
Further reading:
- For a broad view of all the week’s major events worldwide, read the USD outlook.
- For EUR/USD, check out the Euro to Dollar forecast.
- For the Japanese yen, read the USD/JPY forecast.
- For GBP/USD (cable), look into the British Pound forecast.
- For the Australian dollar (Aussie), check out the AUD to USD forecast.
- For USD/CAD (loonie), check out the Canadian dollar forecast.
