USD/JPY posted modest losses last week, as USD/JPY closed the week at 117.15. This week’s highlights are Household Spending and Tokyo Core CPI. Here is an outlook for the highlights of this week and an updated technical analysis for USD/JPY.
US indicators were mostly positive last week. GDP third quarter growth beat expectations with an excellent reading of 3.5% but durable goods orders were mixed. Consumer confidence also looked sharp, rising for a second straight month. In Japan, the BoJ left interest rates at -0.10% and the yen dropped after BoJ Governor ruled out raising rates as inflation remains well short of the target of 2.0 percent.
do action=”autoupdate” tag=”USDJPYUpdate”/]
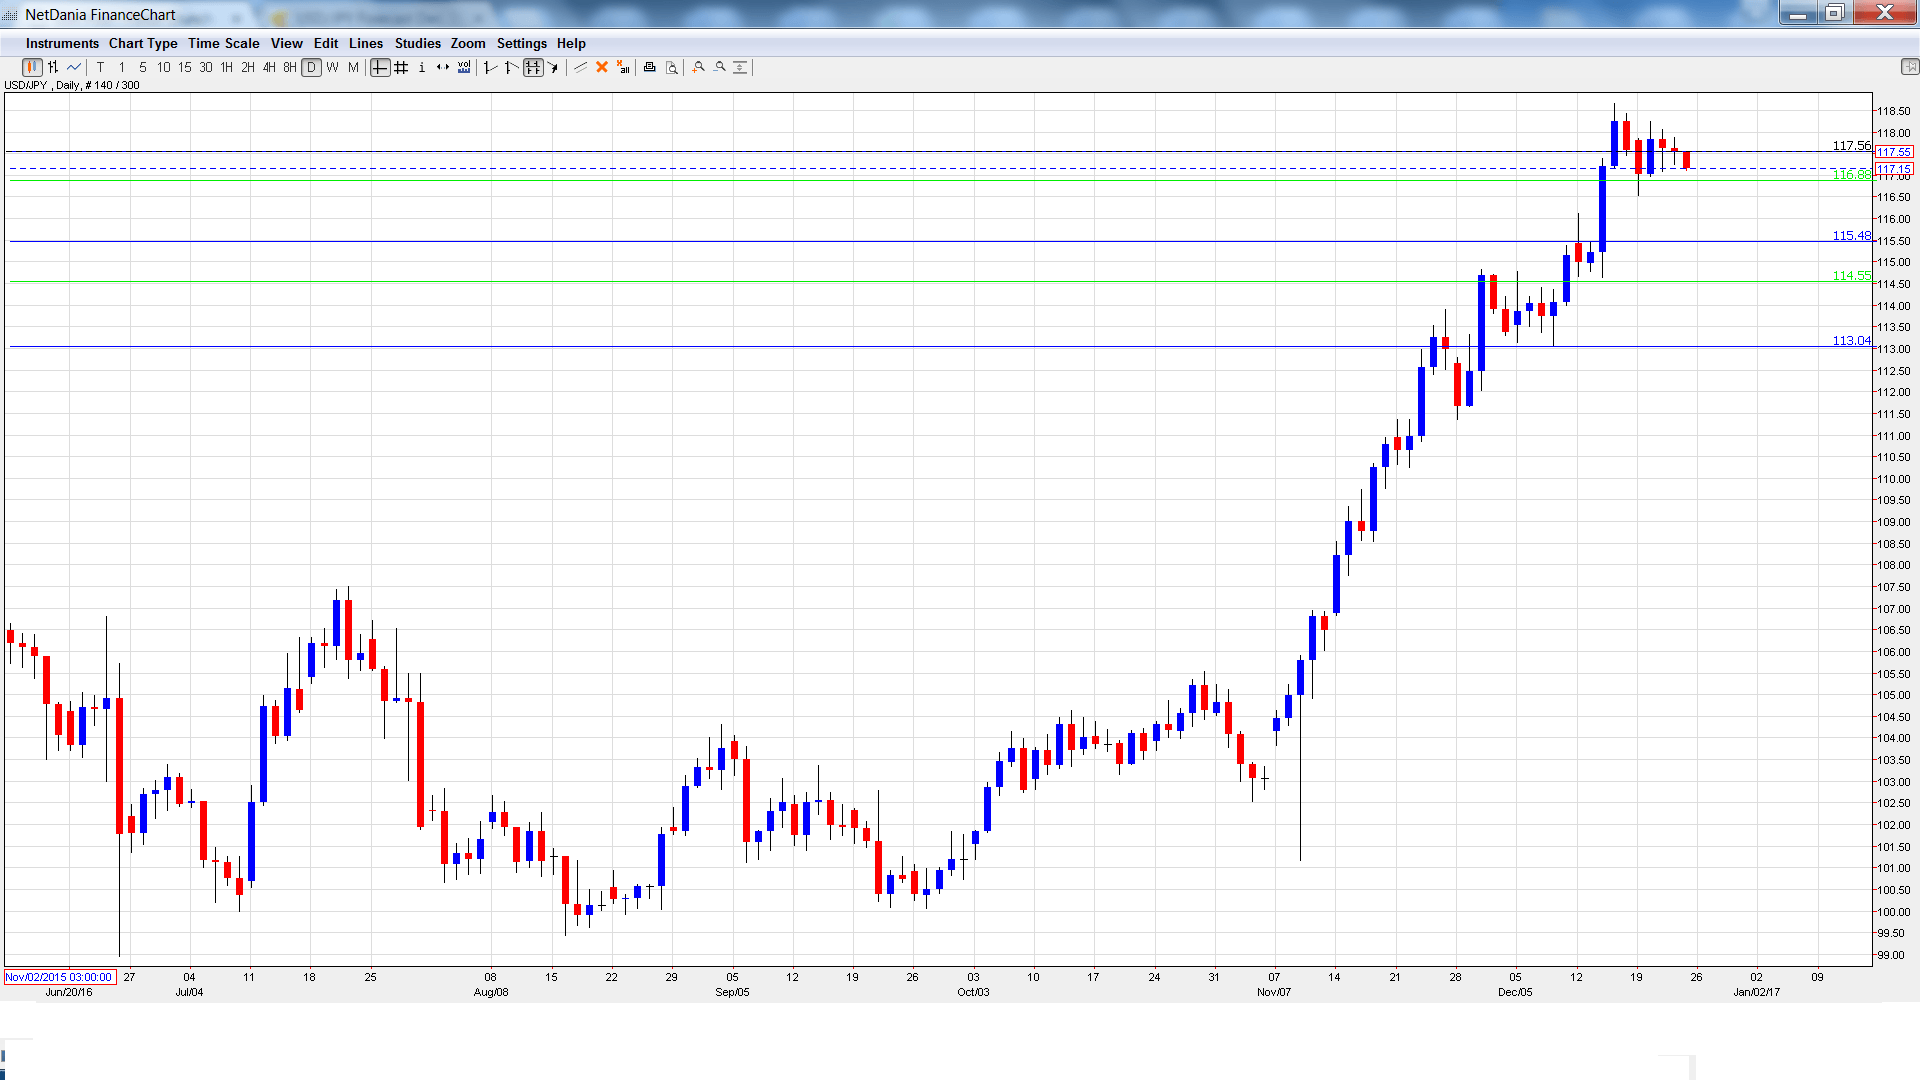
USD/JPY graph with support and resistance lines on it. Click to enlarge:
- BoJ Monetary Policy Meetings Minutes: Sunday, 23:50. The minutes provide details of the November policy statement. Analysts will be looking for clues regarding the BoJ’s future monetary policy.
- Household Spending: Monday, 23:30. This key consumer spending indicator continues to post declines, which is bad news for the economy. In October, the indicator came in at -0.4%, better than the estimate of -1.0%. The markets are expecting a rare gain in November, with an estimate of 0.2%.
- Tokyo Core CPI: Monday, 23:30. This is the most important Japanese inflation index and should be treated as a market-mover. The index has posted 11 straight declines, pointing to deflation. Another decline is expected in December, with an estimate of -0.4%.
- BoJ Core CPI: Tuesday, 5:00. This indicator excludes food and energy prices, which tend to be volatile and distort the underlying inflation trend. The index edged up to 0.3% in October, matching the forecast. The November estimate stands at 0.2%.
- Preliminary Industrial Production: Tuesday, 23:50. This minor indicator showed little change in October, posting a weak gain of 0.1%. This was shy of the estimate of 0.2%.
- BoJ Summary of Opinions: Wednesday, 23:50. This BoJ report contains the bank’s economic and monetary projections, and will be carefully reviewed by analysts looking for clues as to the BoJ’s future monetary policy.
USD/JPY Technical Analysis
USD/JPY opened the week at 117.80 and quickly dropped to a low of 116.54, testing support at 116.88 (discussed last week). The pair then reversed directions and climbed to a high of 118.24. USD/JPY was unable to consolidate at these levels and closed the week at 117.15.
Live chart of USD/JPY:
Technical lines from top to bottom:
121.44 is a strong resistance line.
120.25 is protecting the symbolic 120 level.
118.79 held firm in resistance for a second straight week. This line was last breached in February.
117.52 remains busy and has switched to resistance. It is an immediate line.
116.88 is a weak support level.
115.48 is next.
114.55 marked a high point in March.
113.04 is the final support level for now.
I remain bullish on USD/JPY
Although trading will be light in the US this week, it’s business as usual in Japan, so we could see the dollar resume its rally if Japanese indicators don’t meet expectations.
Our latest podcast is titled What will move markets in 2017
Follow us on Sticher or iTunes
Further reading:
- For a broad view of all the week’s major events worldwide, read the USD outlook.
- For EUR/USD, check out the Euro to Dollar forecast.
- For the Japanese yen, read the USD/JPY forecast.
- For GBP/USD (cable), look into the British Pound forecast.
- For the Canadian dollar (loonie), check out the Canadian dollar forecast.
- For the kiwi, see the NZD/USD forecast.
