The Japanese yen enjoyed another strong week, as USD/JPY dipped over 100 points. The pair closed the week at 112.52. The upcoming week has four events. Here is an outlook on the major events moving the yen and an updated technical analysis for USD/JPY.
In the US, employment numbers improved, as Unemployment Claims dropped to 262 thousand. CPI and Core CPI edged above their estimates, reviving speculation about a March rate hike. In Japan, GDP pointed to contraction in the economy, but there was positive news from Trade Balance and Core Machinery Orders.
do action=”autoupdate” tag=”USDJPYUpdate”/]
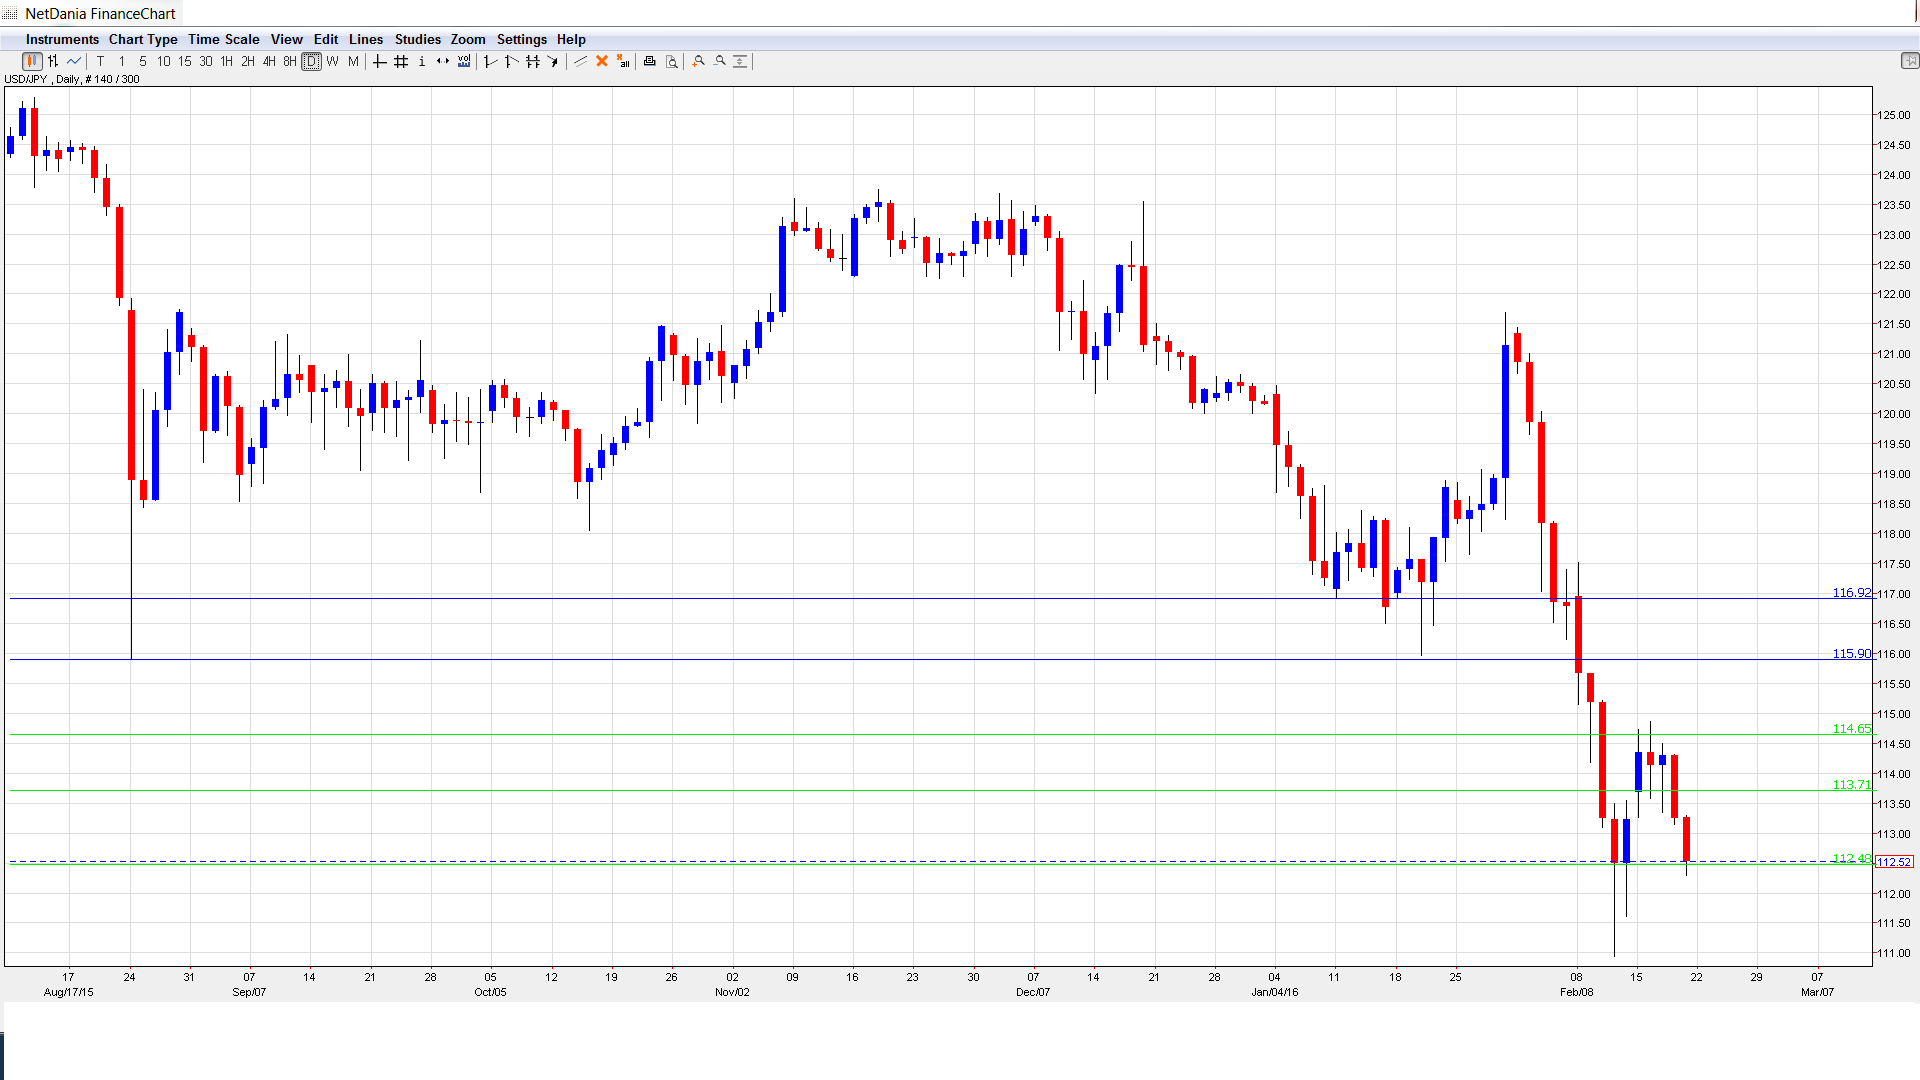
USD/JPY graph with support and resistance lines on it:
- Flash Manufacturing PMI: Monday, 2:00. Despite the limping Japanese economy, this PMI continues to point to an expanding manufacturing sector. The indicator came in at 52.4 points in January, and the forecast for February stands at 52.0 points.
- SPPI: Tuesday, 23:50. A host of inflation indicators kicks off with SPPI, which measures inflation in the corporate sector. The index improved to 0.4% in December, beating the estimate of 0.2%. The forecast for the January report stands at 0.3%.
- Tokyo Core CPI: Thursday, 23:30. This is the most important Japanese inflation indicator, and an unexpected reading can have an immediate impact on the movement of USD/JPY. The index declined by 0.1% in January, short of the forecast of +0.1%. Another weak reading is expected, with an estimate of a flat reading of 0.0%.
- BOJ Core CPI: Friday, 5:00. Core CPI excludes the most volatile items which make up CPI, and is the inflation indicator which the BOJ primarily relies upon. The index has been quite steady and posted a gain of 1.3% in December. Little change is expected in the January report, with an estimate of 1.2%.
* All times are GMT
Live chart of USD/JPY: [do action=”tradingviews” pair=”USDJPY” interval=”60″/]
USD/JPY Technical Analysis
USD/JPY opened the week at 113.67 and touched a high of 114.87, testing resistance at 114.65 (discussed last week). The pair then reversed directions and slipped to a low of 112.30. USD/JPY closed the week at 112.52.
Technical lines from top to bottom:
With the pair posting sharp losses last week, we start at lower levels:
116.90 supported dollar/yen early in 2015.
115.90 was an important cushion for most of 2015.
114.65 is next.
113.71 was an important resistance line in July 2005.
112.48 marked the start of a yen rally in January 2008, which saw USD/JPY drop below the 100 level.
110.68 represented a high point of a strong dollar rally in August 2008, which started around the key 100 level.
108.58 is the final support line for now.
I am neutral on USD/JPY
The February yen rally continues, as nervous investors continued to flock to the safe-haven yen in response to ongoing global financial turbulence. At the same time, US fundamentals are still much better than those of Japan, and monetary divergence favors the US dollar.
Our latest podcast is titled Oil’n’gold merry go round
Follow us on Sticher or on iTunes
Further reading:
- For a broad view of all the week’s major events worldwide, read the USD outlook.
- For EUR/USD, check out the Euro to Dollar forecast.
- For the Japanese yen, read the USD/JPY forecast.
- For GBP/USD (cable), look into the British Pound forecast.
- For the Australian dollar (Aussie), check out the AUD to USD forecast.
- For the kiwi, see the NZDUSD forecast.
