The Japanese yen lost ground for a second straight week. USD/JPY closed at 114.61. This week’s key event is the BoJ Policy Rate. Here is an outlook for the highlights of this week and an updated technical analysis for USD/JPY.
In the US, an excellent nonfarm payrolls report has virtually ensured a rate hike coming next week. However, wage growth disappointed, falling short of the forecast. In Japan, Final GDP was revised upwards to 0.3% growth, up from last month’s preliminary estimate of 0.2%. BSI Manufacturing
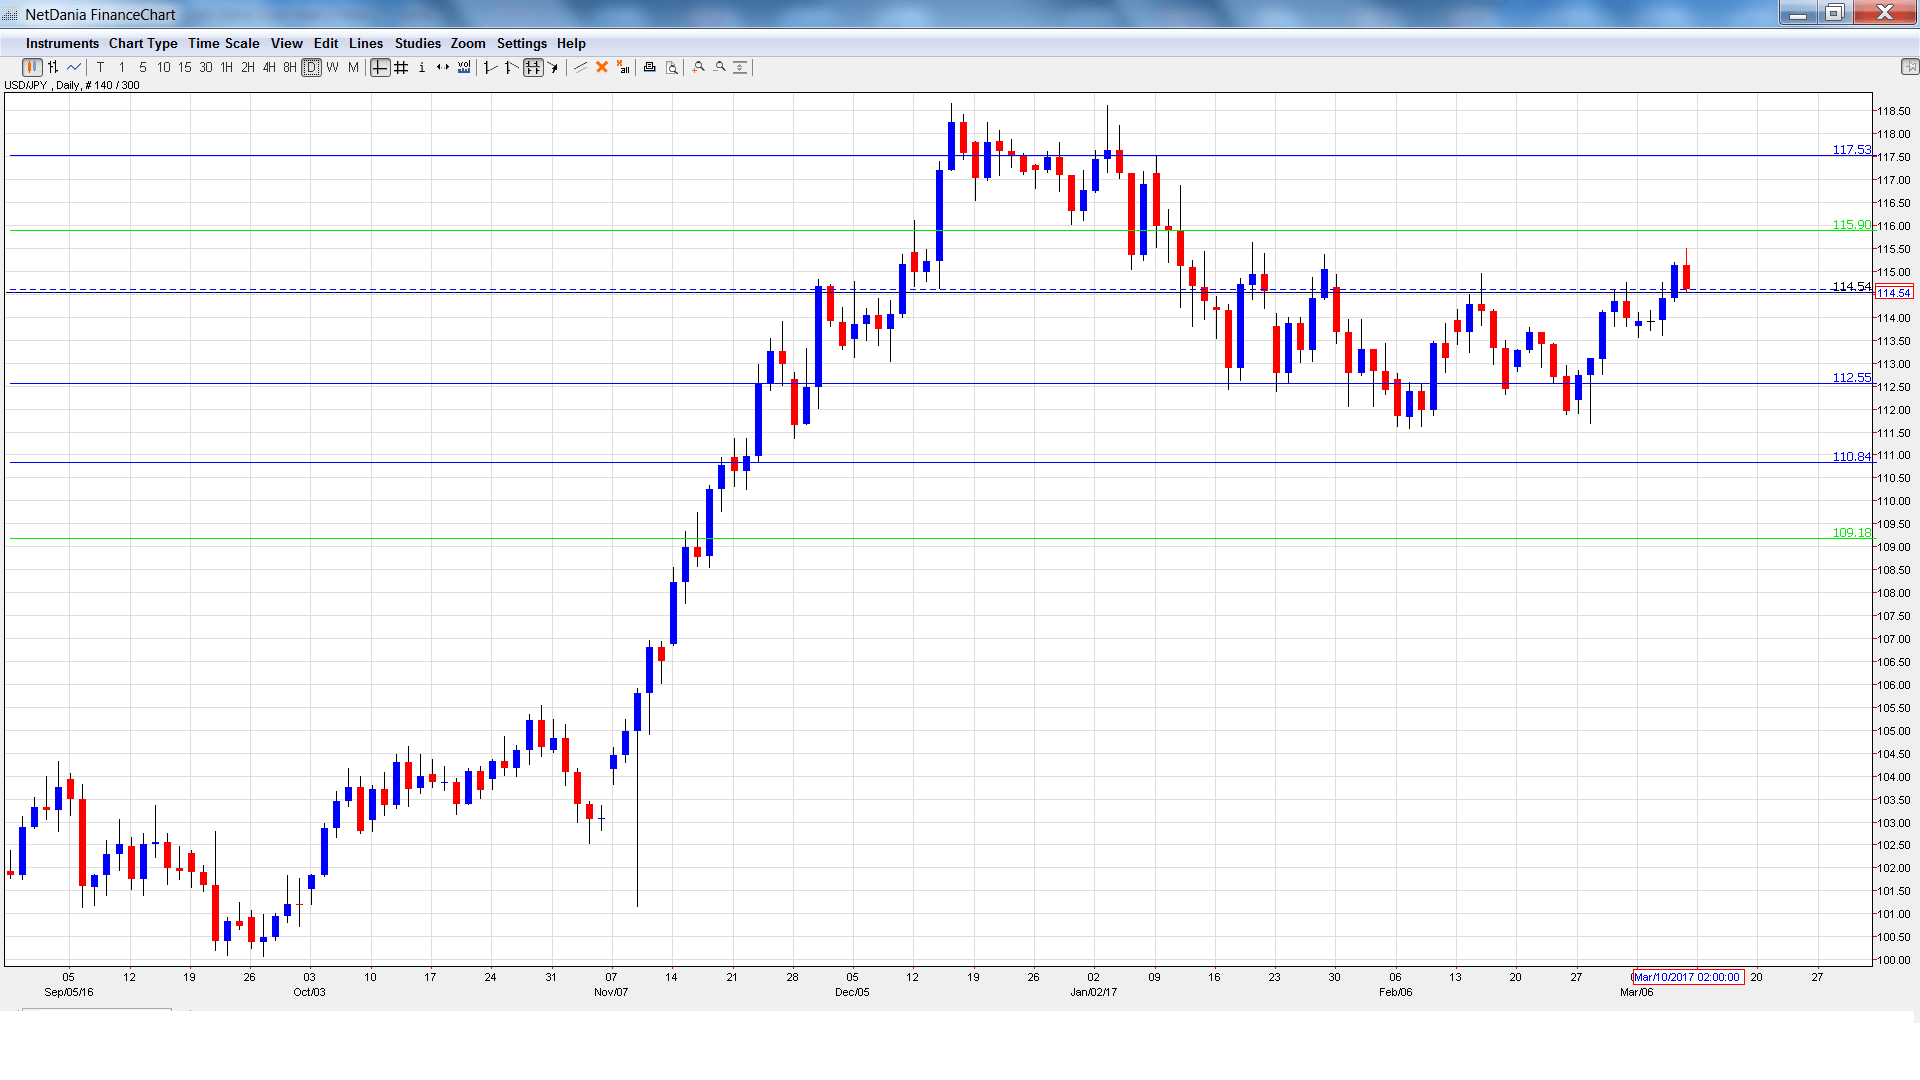
[do action=”autoupdate” tag=”USDJPYUpdate”/]USD/JPY graph with support and resistance lines on it. Click to enlarge:
- Core Machinery Orders: Sunday, 23:50. The indicator tends to exhibit strong movement, making accurate forecasts a tricky task. In December, the indicator rebounded with a strong gain of 6.7%, well above the forecast of 3.2%. The markets are expecting a softer January, with an estimate of 0.0%.
- PPI: Sunday, 23:50. The index posted a gain of 0.5% in January, above the estimate of 0.0%. This halted a nasty streak of almost 2 years. The upswing is expected to continue in February, with an estimate of 1.0%.
- Tertiary Industry Activity: Monday, 4:30. The indicator declined 0.4% in December, worse than the forecast of -0.1%. The markets are anticipating a rebound in January, with an estimate of 0.2%.
- Revised Industrial Production: Wednesday, 4:30. In December, the indicator softened to 0.7%, but this was enough to beat the forecast of 0.5%. The markets are braced for a decline of 0.8% in January.
- BoJ Policy Rate: Thursday, Tentative. The Bank of Japan is expected to keep interest rates at 0.10%, where they have been pegged for over a year. Analysts will be keeping a close eye on the rate statement, which could provide hints as to the central bank’s monetary policy plans. A press conference will follow the rate statement.
USD/JPY opened the week at 113.81 and dropped to a low of 113.55. The pair then reversed directions and late in the week climbed to a high of 115.50 (discussed last week). USD/JPY was unable to consolidate at this level and closed the week at 114.61.
Live chart of USD/JPY:
Technical lines from top to bottom:
118.66 has held in resistance since February 2016.
117.53 was a high point in January.
115.90 is next.
114.55 was an important cap in mid-2016.
112.53 is providing support.
110.83 is next.
109.18 marked the start of a rally in September 2008 which saw USD/JPY drop close to the 0.87 level. It is the final support line for now.
I am bullish on USD/JPY
The markets have priced in an expected rate hike next week in the US, but the move should still reinvigorate the markets and push up the US dollar. With the US economy continue to perform well, the US dollar remains attractive to investors.
Our latest podcast is titled Fed fever and crashing crude in the Ides of March
Follow us on Sticher or iTunes
“‹
Safe trading!
Further reading:
- For a broad view of all the week’s major events worldwide, read the USD outlook.
- For EUR/USD, check out the Euro to Dollar forecast.
- For the Japanese yen, read the USD/JPY forecast.
- For GBP/USD (cable), look into the British Pound forecast.
- For the Canadian dollar (loonie), check out the Canadian dollar forecast.
- For the kiwi, see the NZD/USD forecast.
