USD/JPY recorded small losses last week, as the pair closed at 103.70. This week’s key event is Tokyo CPI. Here is an outlook for the highlights of this week and an updated technical analysis for USD/JPY.
In the US, unemployment claims surprised by missing expectations for the first time in 10 weeks. Construction data was mixed while manufacturing numbers were stronger than expected. There were no major releases out of Japan last week.
do action=”autoupdate” tag=”USDJPYUpdate”/]
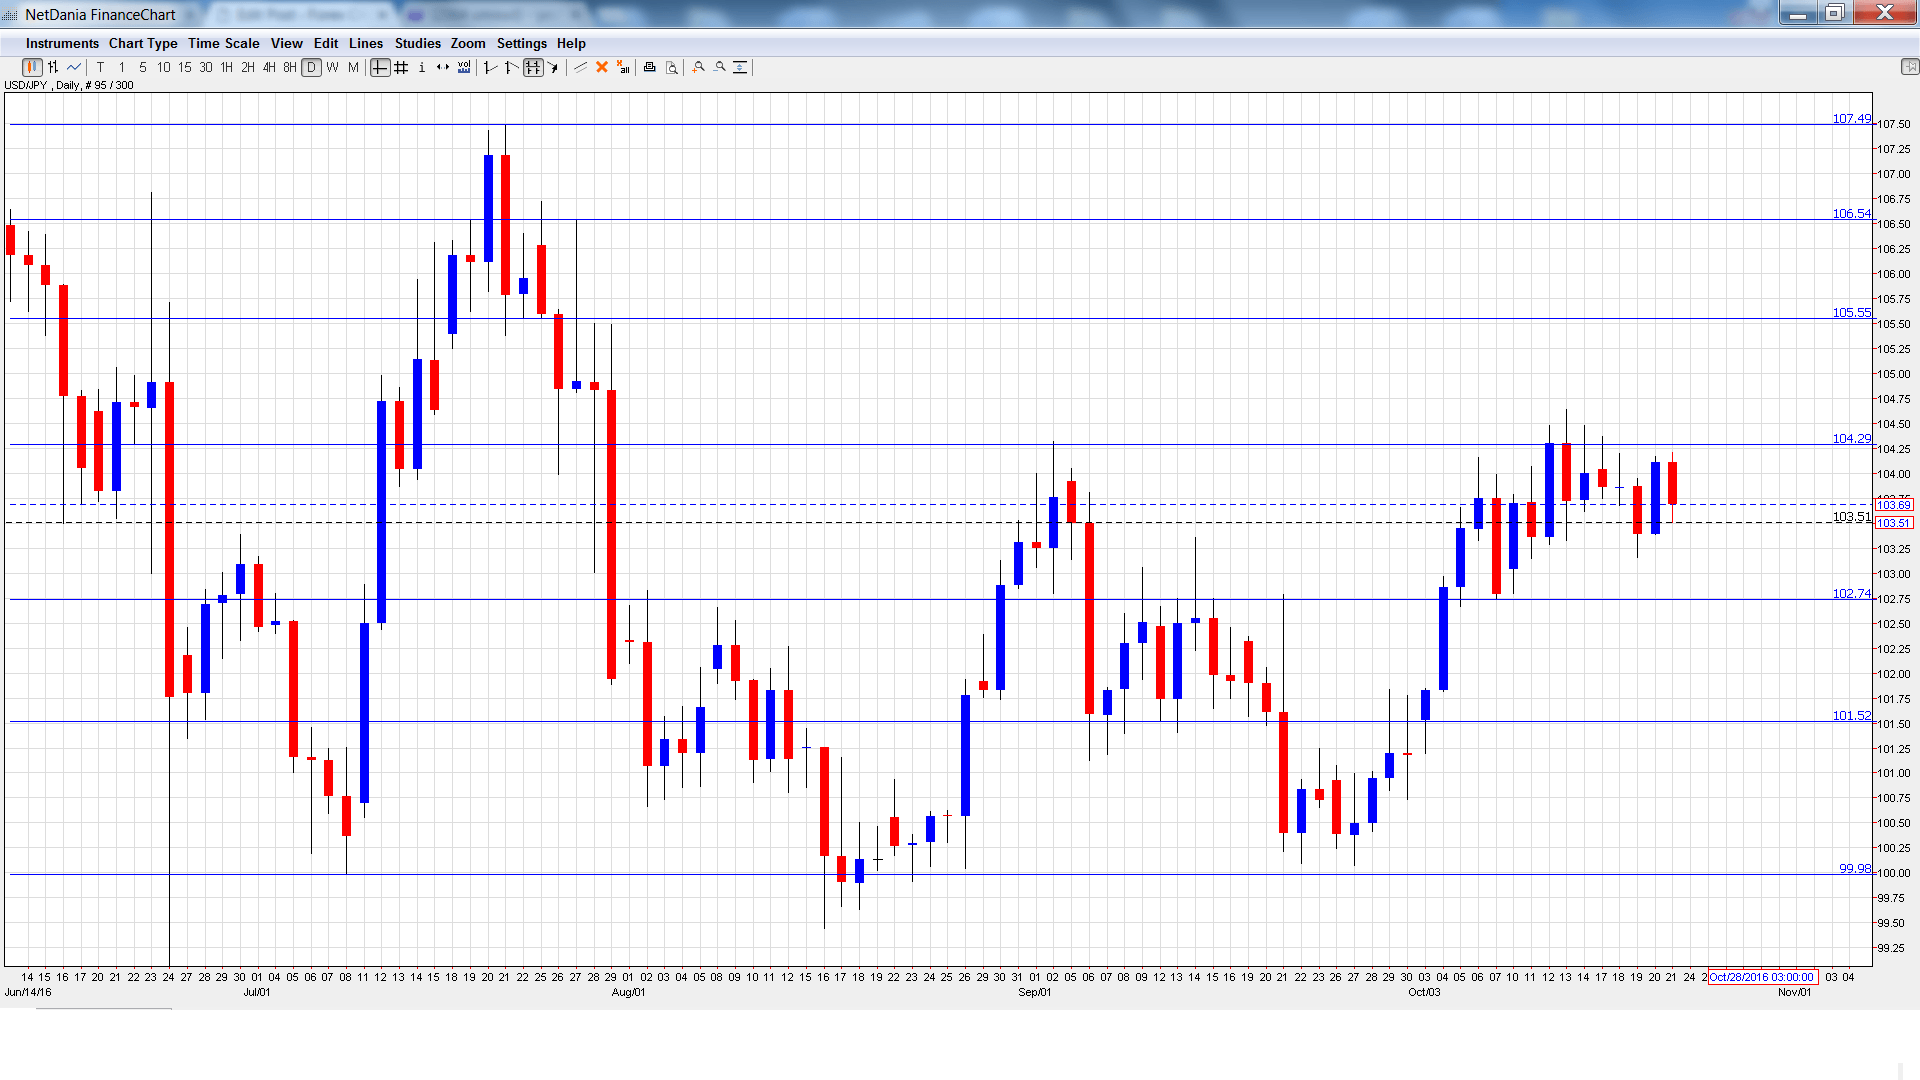
USD/JPY graph with support and resistance lines on it. Click to enlarge:
- Trade Balance: Sunday, 23:50. This indicator is closely linked to currency demand. Japan’s surplus rose to 0.41 trillion yen in August, but this was short of expectations. The surplus is expected to fall to 0.21 trillion yen in September.
- Flash Manufacturing PMI: Monday, 00:30. The index has been contracting for most of 2016, but managed to push above the 50-line in September, with a reading of 50.3 points. The estimate for the October release is 50.6 points.
- SPPI: Tuesday, 23:50. This index measures inflation in the corporate sector. The indicator dipped to 0.2% in August shy of the forecast of 0.3%. Another reading of 0.2% is expected in the September report.
- Household Spending: Thursday, 23:30. Consumer spending is closely watched, as it is a key driver of economic growth. The indicator continues to record declines and fell 4.6% in August, well below expectations. The forecast for the September report is -2.6%.
- Tokyo Core CPI: Thursday, 23:30. This is the key event of the week and should be treated as a market-mover. Inflation levels are at rock-bottom levels, and the indicator declined 0.5% in September, missing the estimate of -0.4%. Another decline of 0.5% is expected in the October report.
- BoJ Core CPI: Friday, 5:00. The indicator has been losing ground and dropped to 0.4% in the previous release. The downturn is expected to continue, with an estimate of 0.3%.
* All times are GMT
USD/JPY Technical Analysis
USD/JPY opened the week at 104.04 and quickly touched a high of 104.37. USD/JPY then moved downwards and dropped to a low of 103.16, as support held at 102.74 (discussed last week). The pair closed the week at 103.69.
Live chart of USD/JPY:
Technical lines from top to bottom:
We begin with resistance at 107.49, which was the high point in July.
106.55 is next.
105.55 was a cushion in May and June.
104.25 was tested in resistance for a second straight week.
102.74 is providing support.
101.52 is next.
99.98 has held in support since late August. It is the final support line for now.
I am neutral on USD/JPY
The BoJ has been reluctant to take further monetary easing measures, which could lead to the yen gaining ground. At the same time, a December rate hike has been priced in at 70%, so the dollar stands to benefit from expectations of a rate hike.
Our latest podcast is titled Bold BOJ vs. Fearful Fed
Follow us on Sticher or iTunes
Further reading:
- For a broad view of all the week’s major events worldwide, read the USD outlook.
- For EUR/USD, check out the Euro to Dollar forecast.
- For the Japanese yen, read the USD/JPY forecast.
- For GBP/USD (cable), look into the British Pound forecast.
- For the Canadian dollar (loonie), check out the Canadian dollar forecast.
- For the kiwi, see the NZD/USD forecast.
